A walkthrough, start to finish
From first login to a fully monitored fleet. Every screenshot below is the real app.
- 1
Sign in
Standard OpenID Connect (OIDC) login. Your role is issued as a claim at sign-in, so page access and API permissions agree from the very first request — there is no second, separate permission model to keep in sync.
- 2
See the whole estate at once
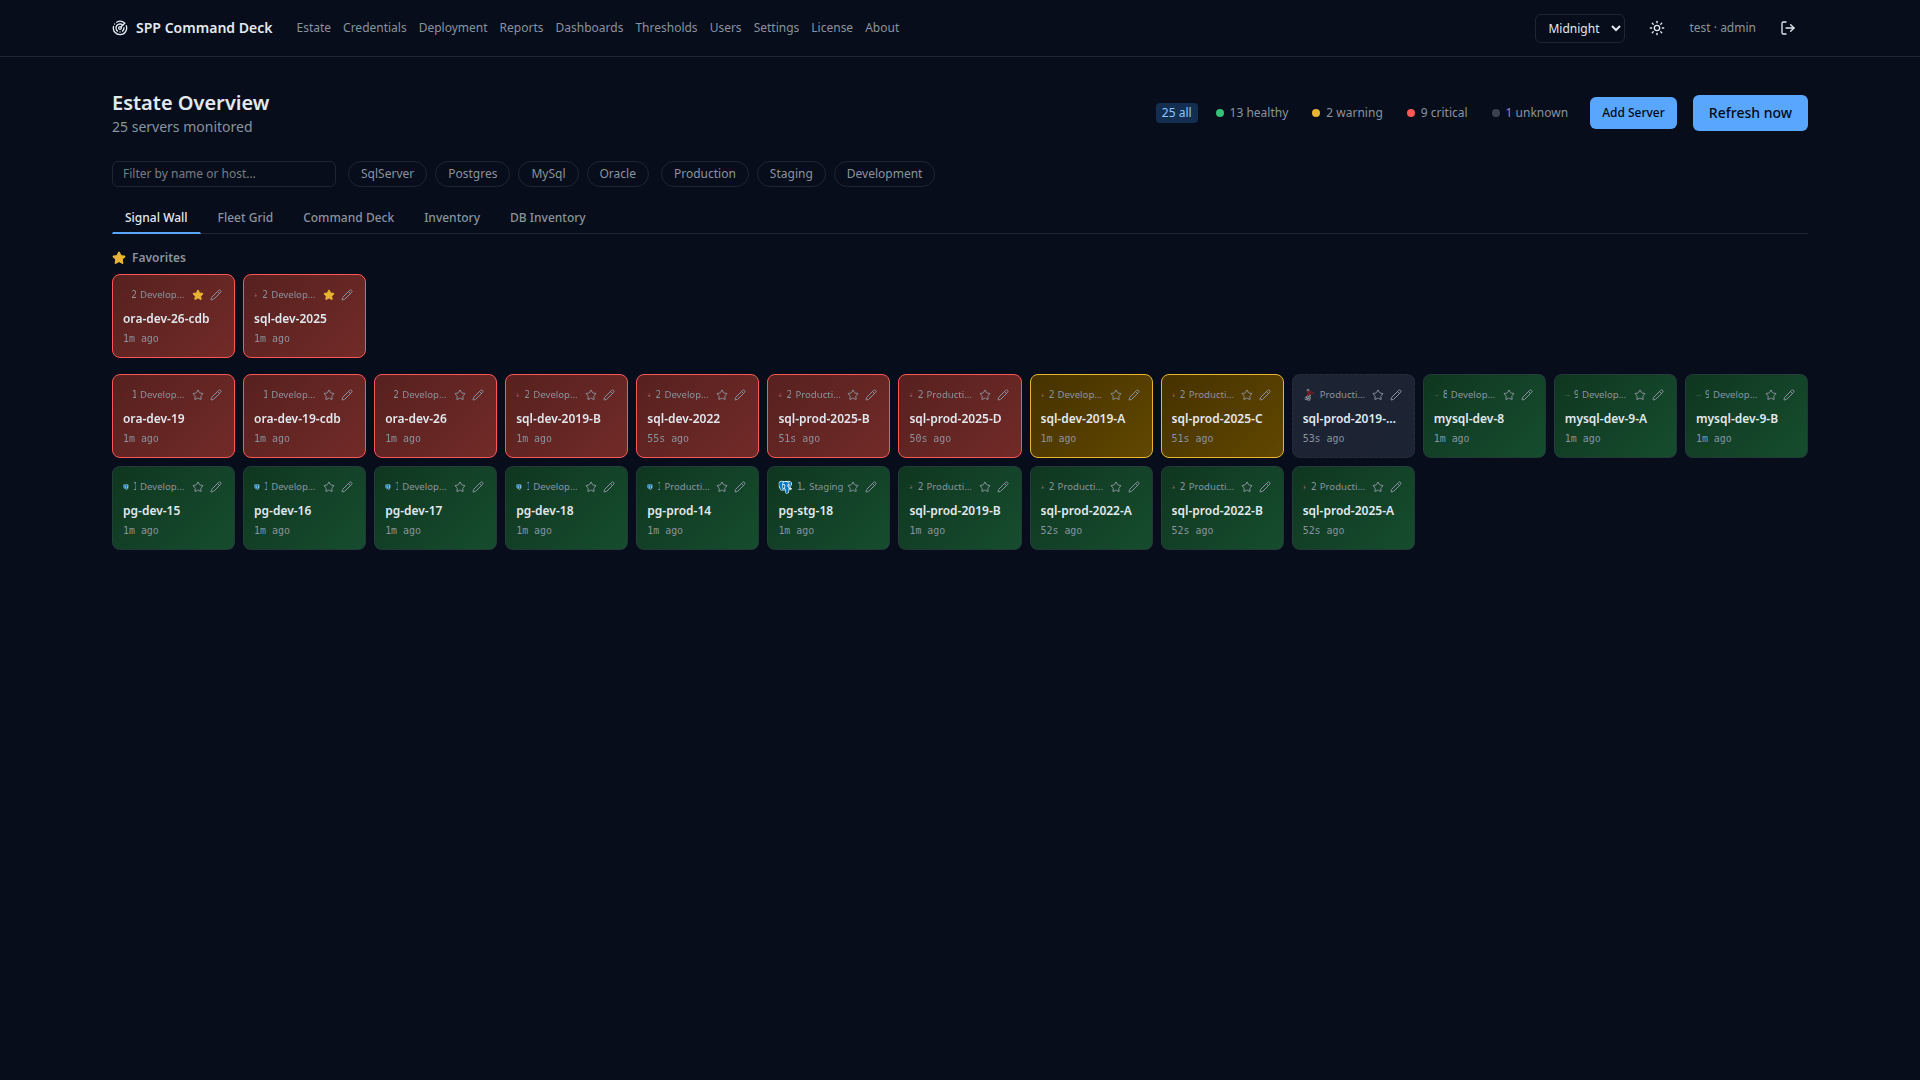
Every monitored server, colored by its worst check, filterable by engine and environment. SQL Server, Oracle, PostgreSQL and MySQL sit side by side in one view instead of four consoles, with favorites pinned on top and a running healthy / warning / critical count. This Signal Wall is where you land at sign-in, and the page you leave open on a second monitor.
- 3
Fleet Grid — density for a big estate
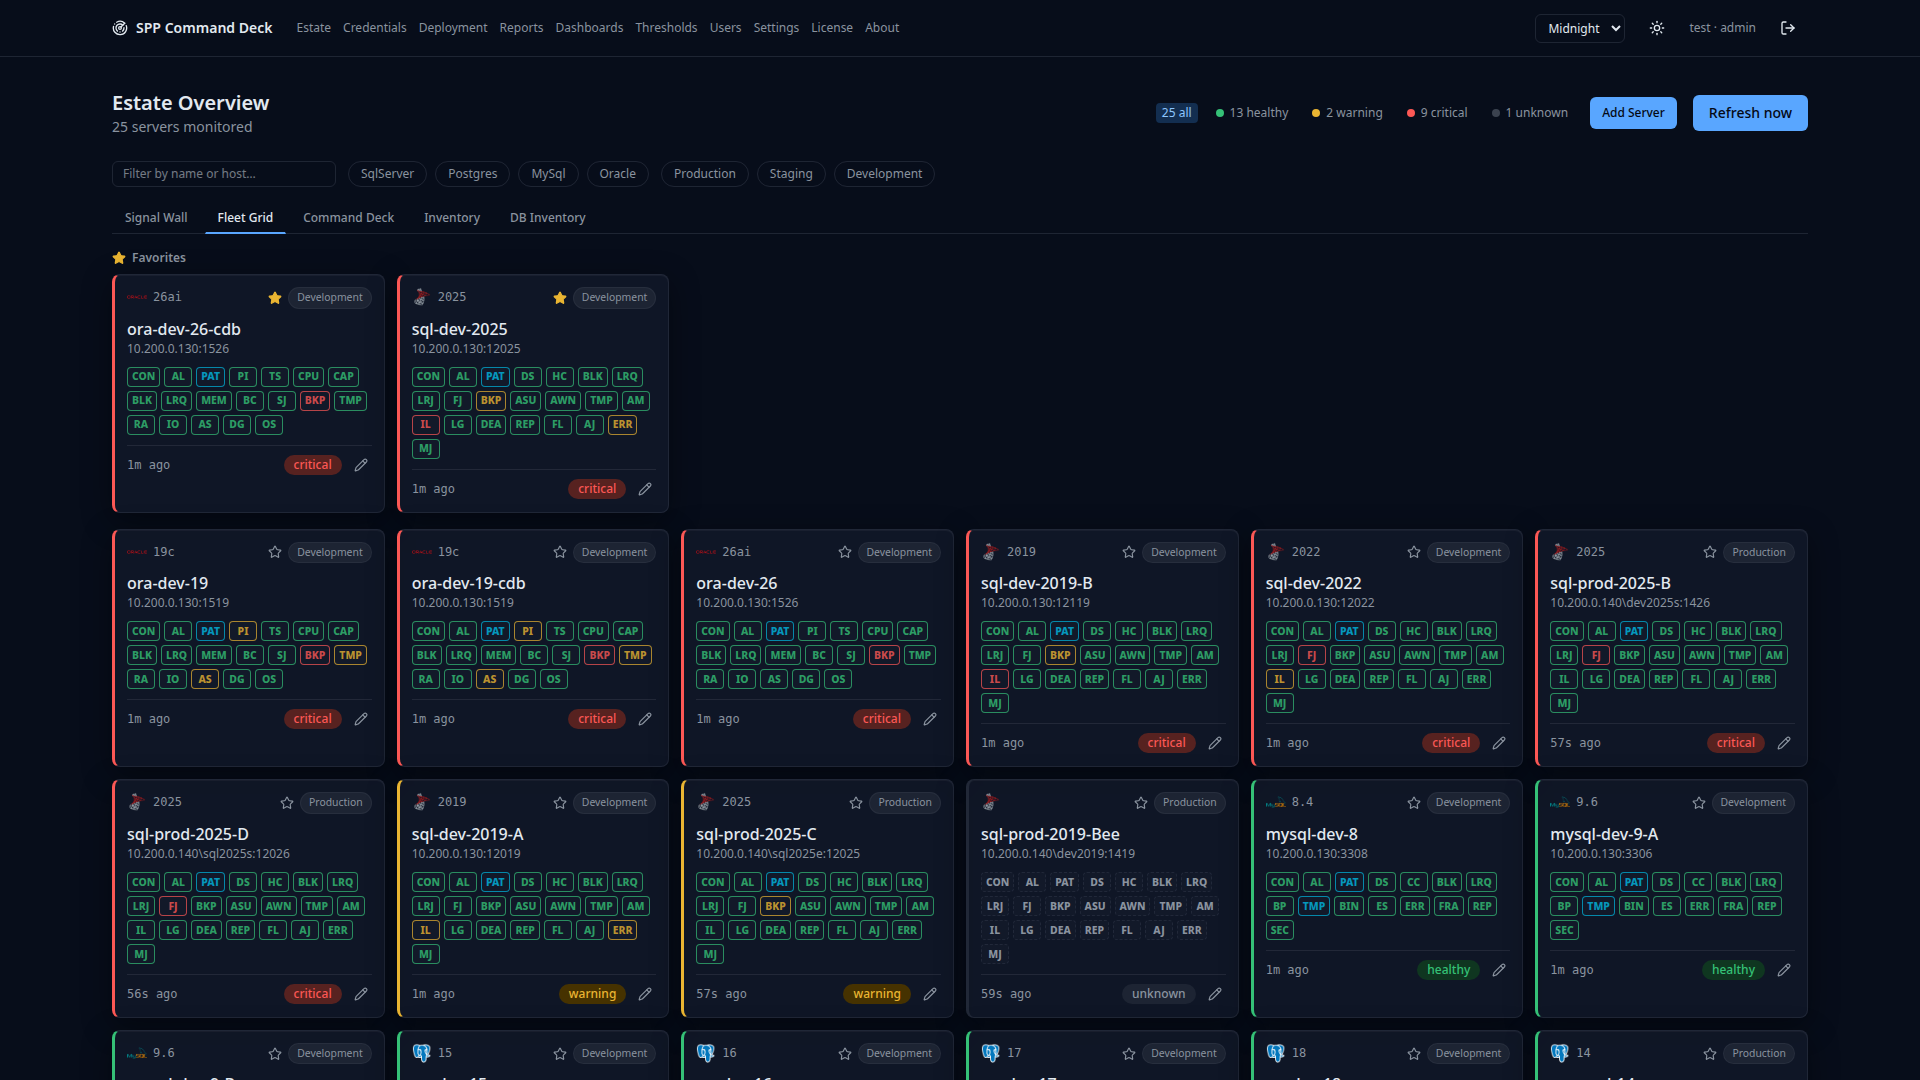
One compact row per server. When you monitor dozens of instances, this fits the whole fleet on one screen without scrolling.
- 4
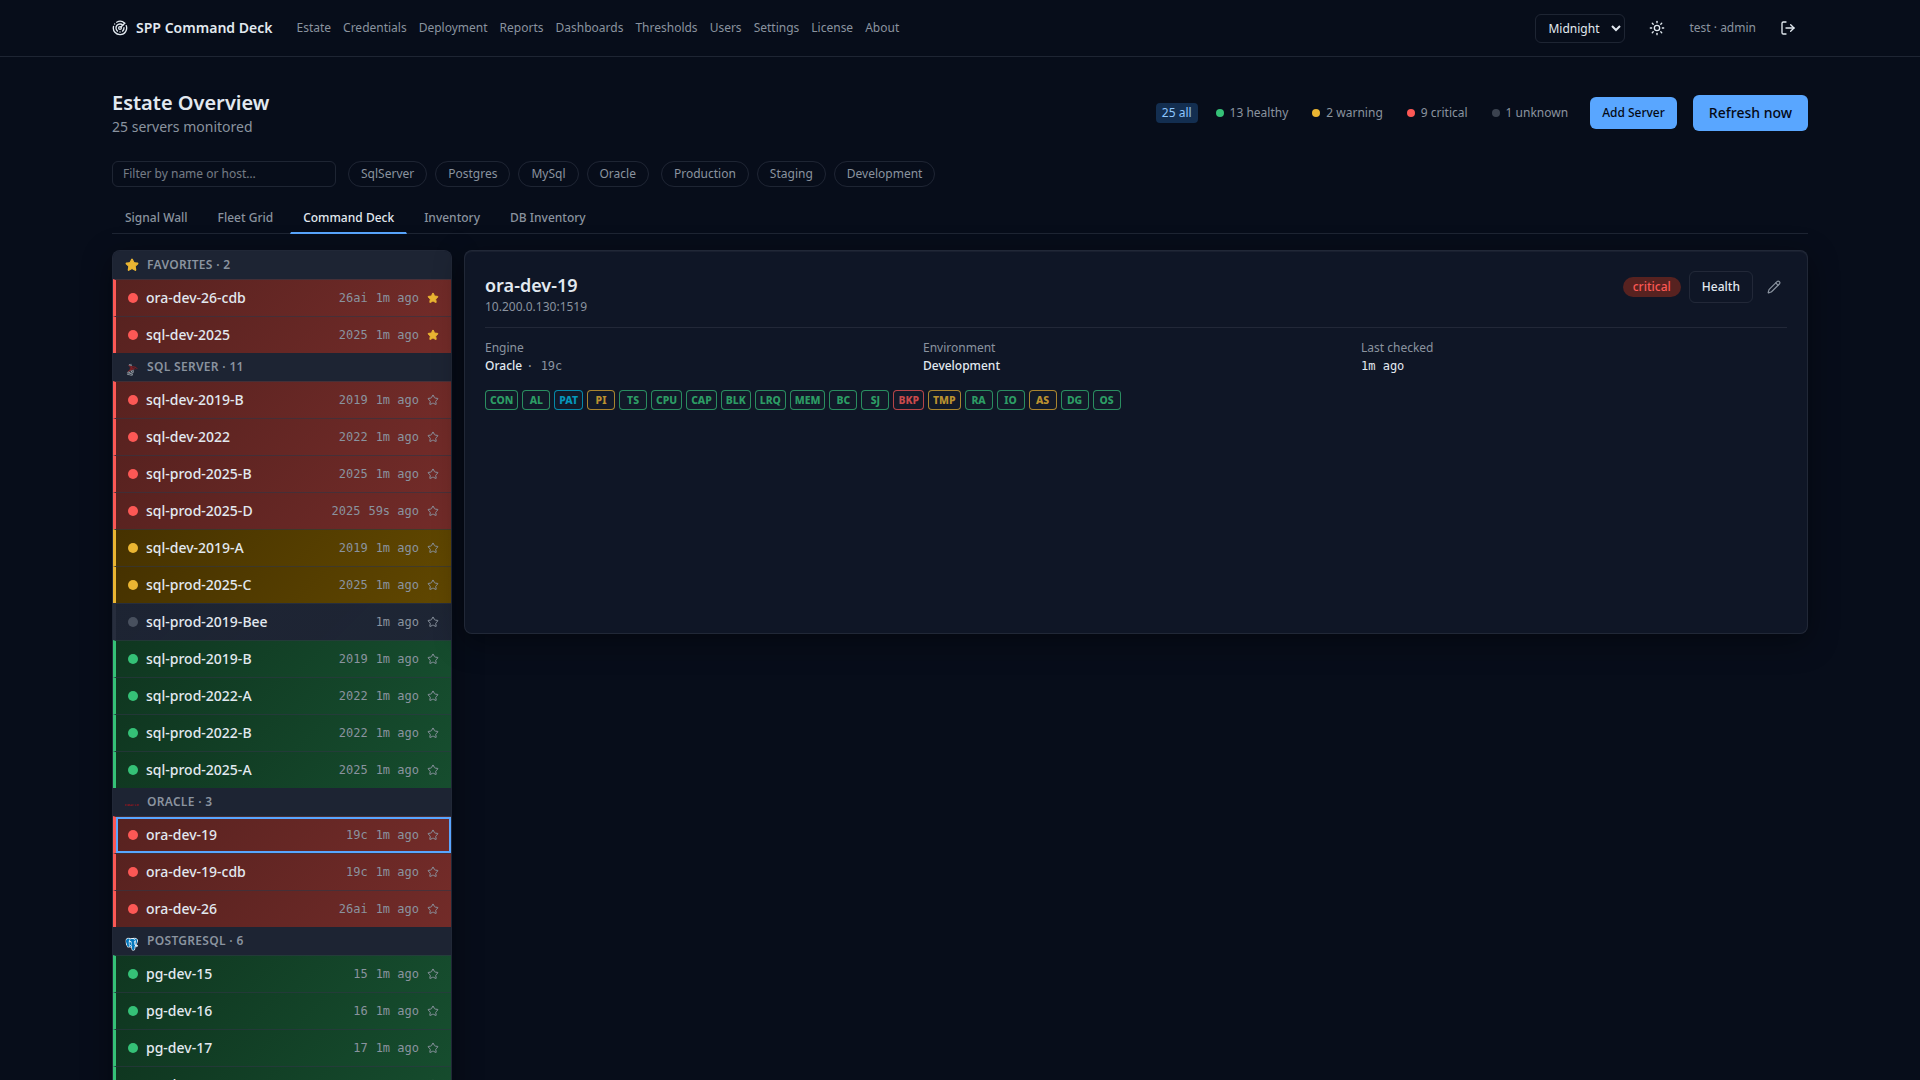
Command Deck — the morning check
Estate-wide rollups and the counts that tell you whether today is normal. The view to open with coffee, before anyone has filed a ticket.
- 5
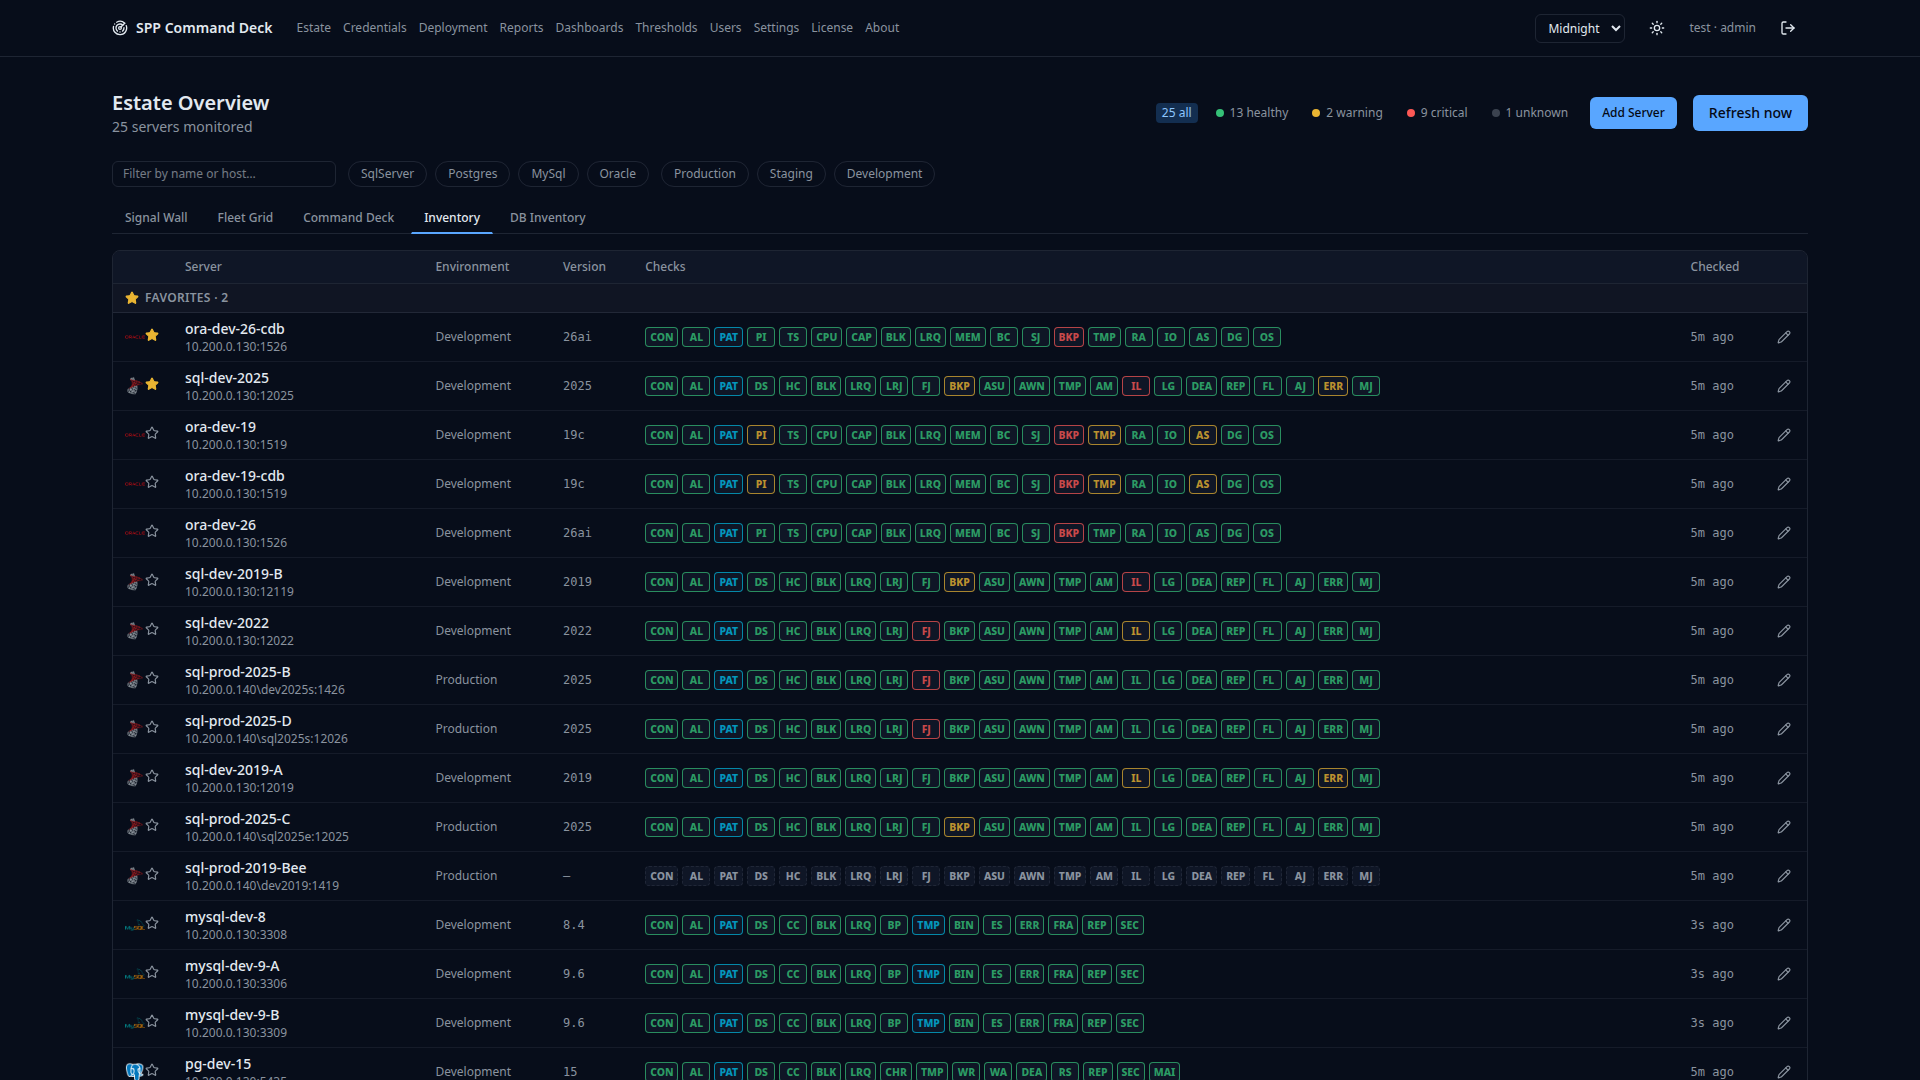
Inventory — the flat list
Every server as plain sortable rows: name, host, engine, environment, last check. The view for answering "what do we actually have?" rather than "what is broken right now?"
- 6
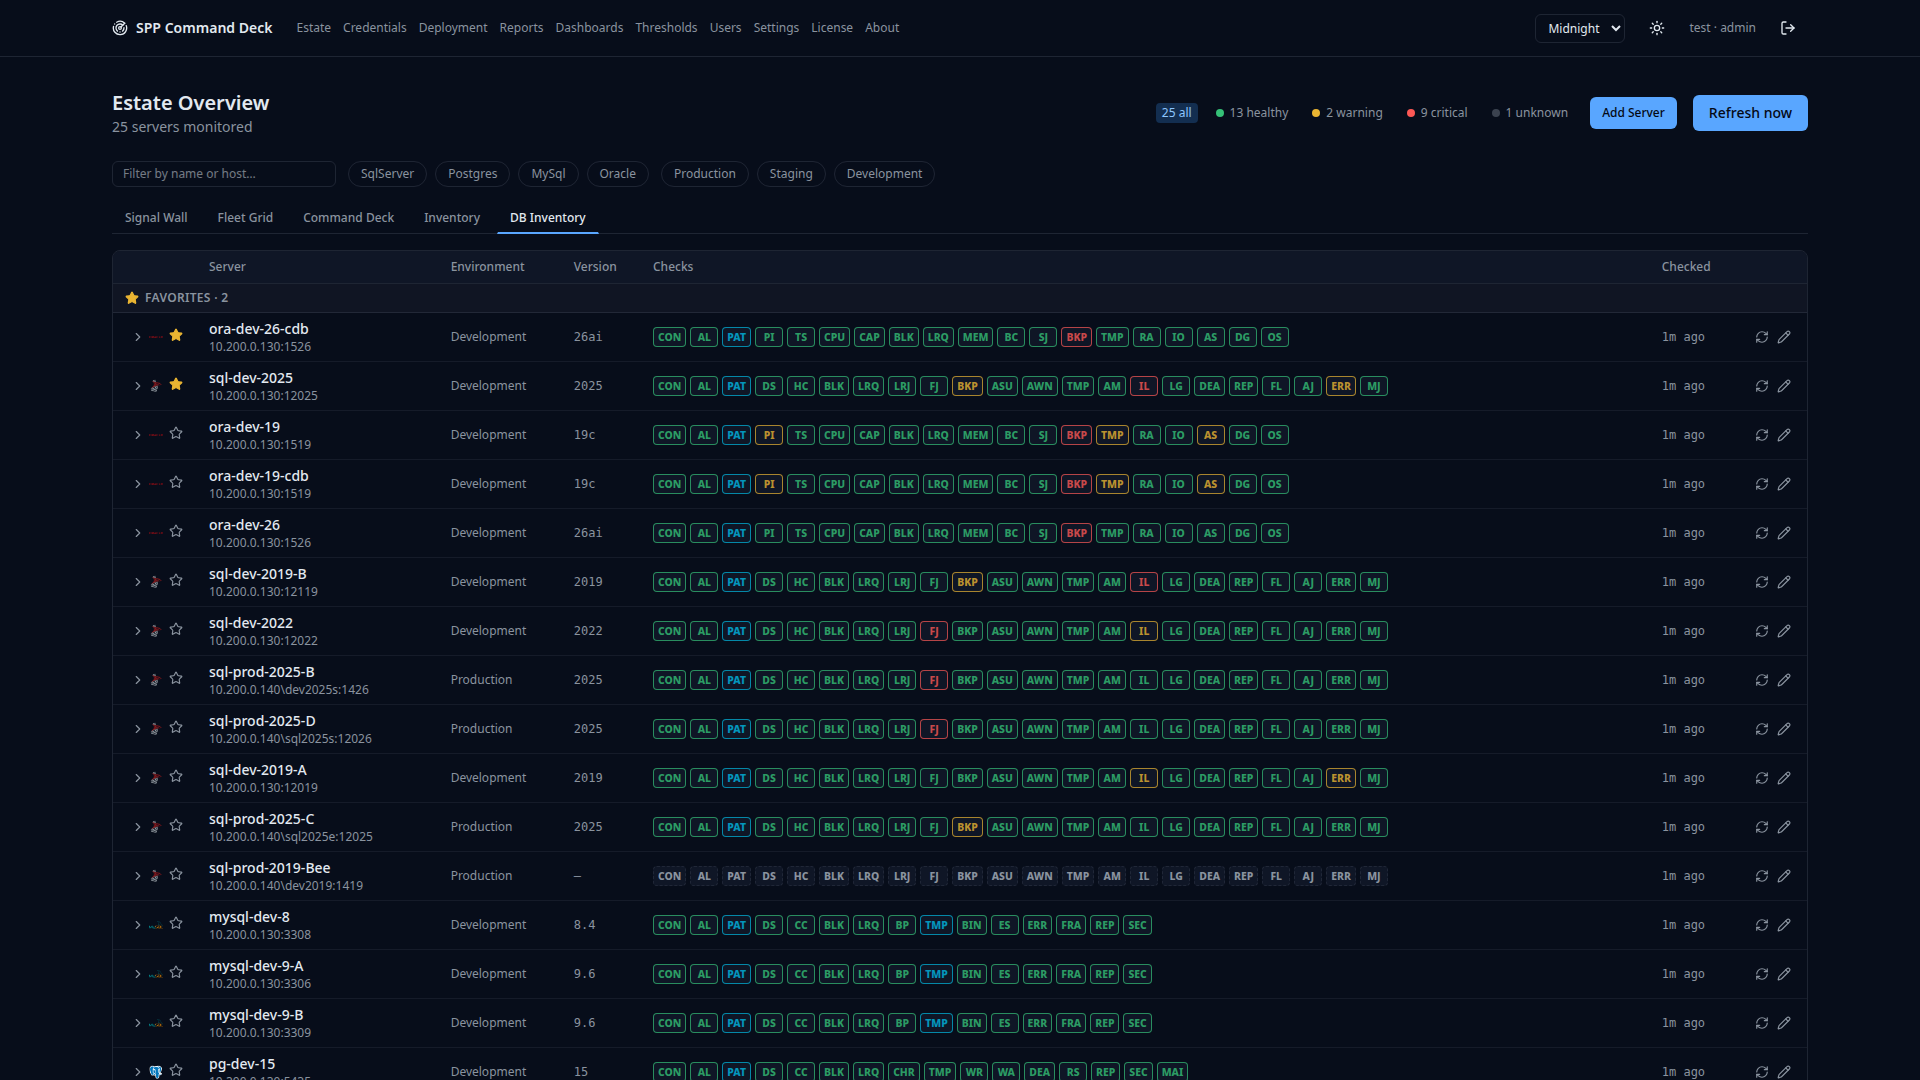
DB Inventory — down to the database
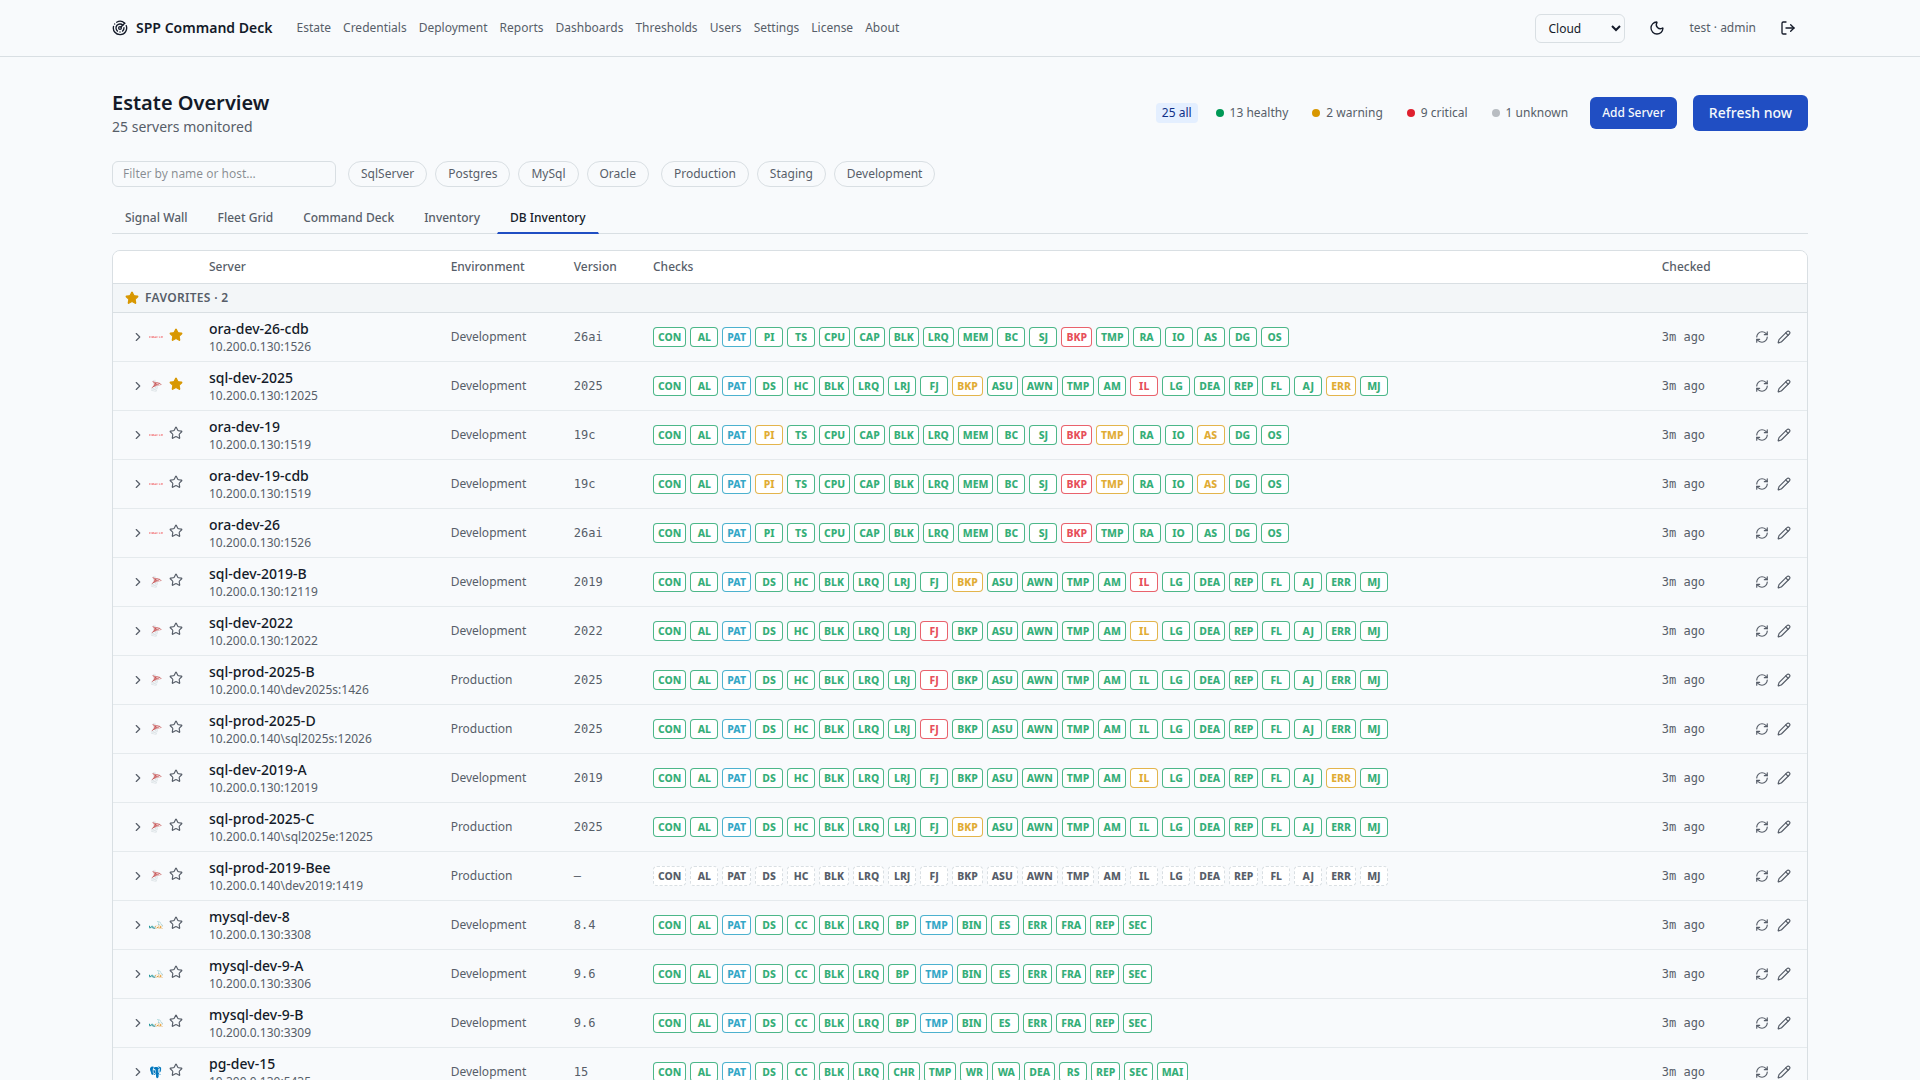
Expand a server to see its individual databases, each with its own check results. Oracle pluggable databases, SQL Server user databases and Postgres databases all appear the same way.
- 7
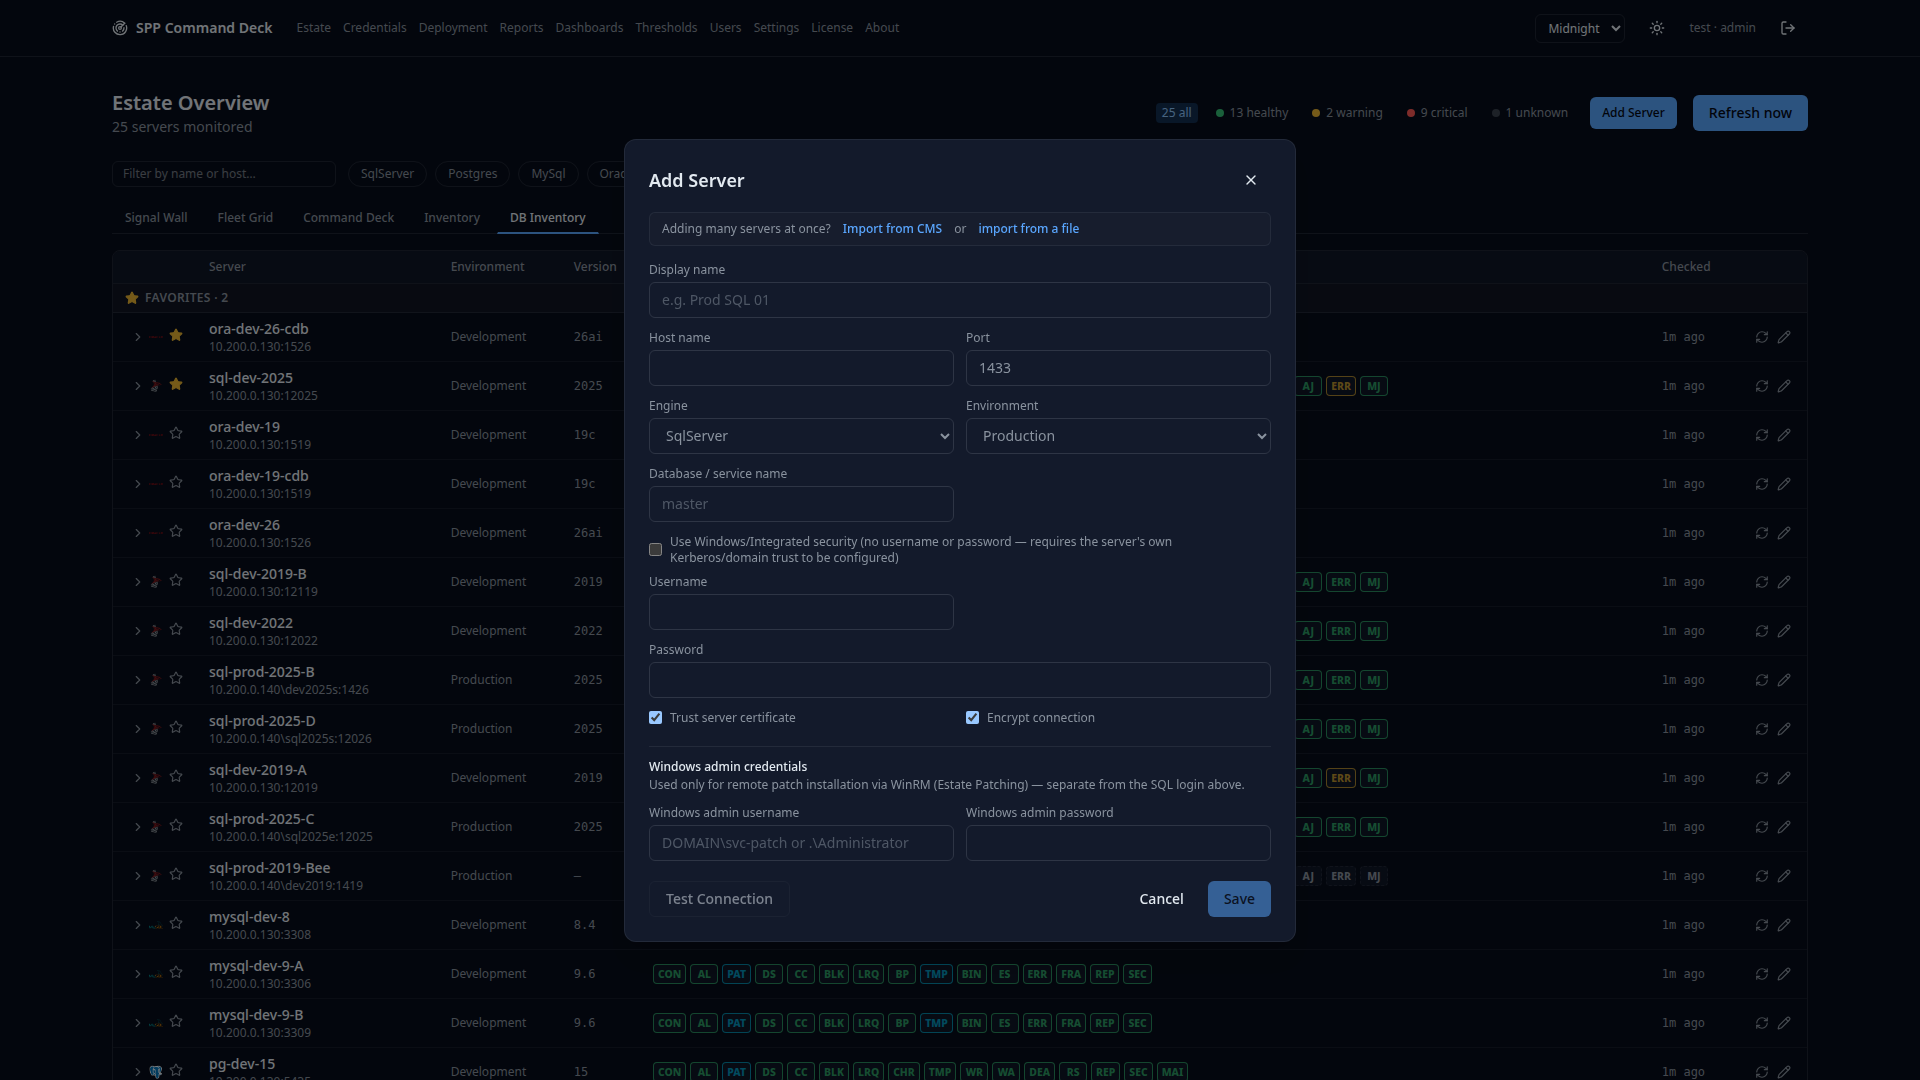
Add the next one in seconds
Test the connection before saving, or skip straight to save and fix credentials later — bad credentials never block adding a server to inventory.
- 8
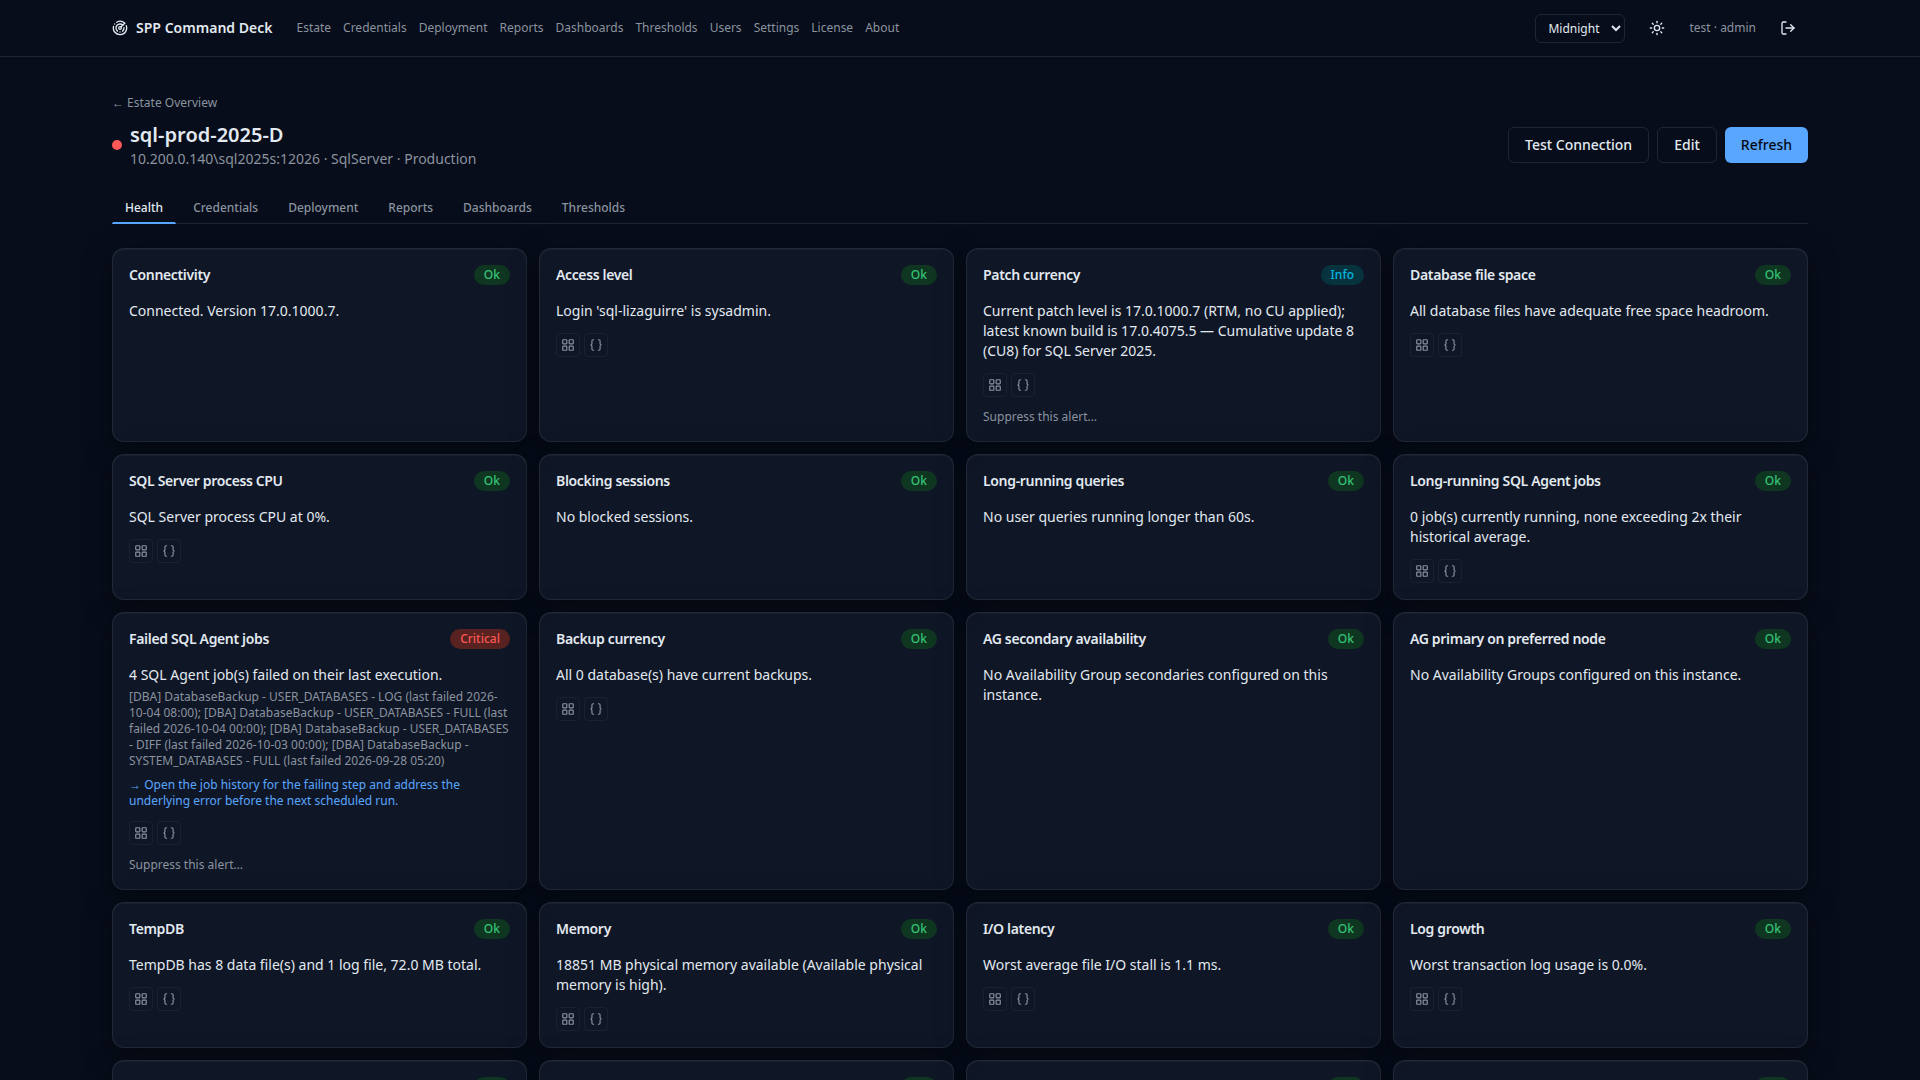
Drill into one server
The full check breakdown for a single instance, four panels per row, each with the raw value behind it rather than just a color. Here a production SQL Server is flagged critical for four failed SQL Agent jobs — named, timestamped, with the next action spelled out.
- 9
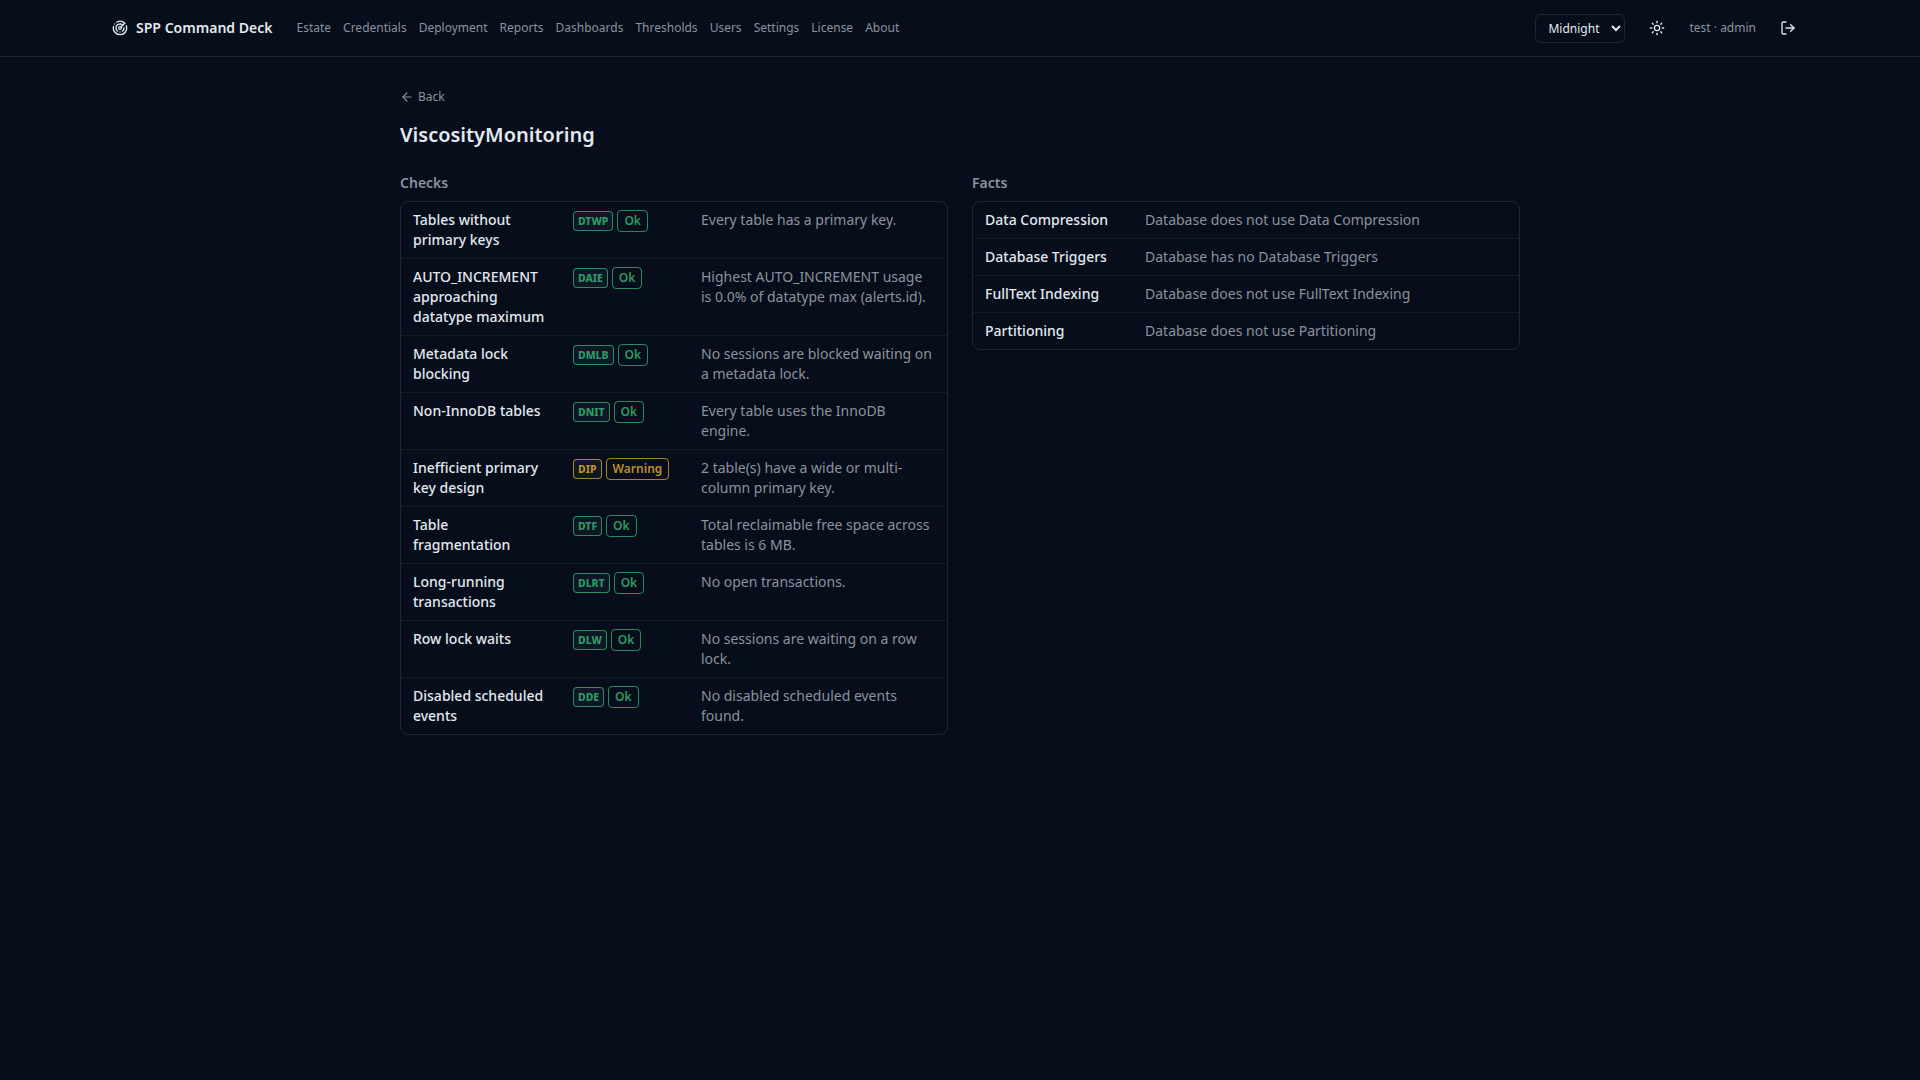
And into one database
Per-database checks, scoped to the one database you are being asked about: missing primary keys, metadata lock blocking, non-InnoDB tables, fragmentation — each with its own code — alongside a Facts panel for compression, triggers, full-text and partitioning.
- 10
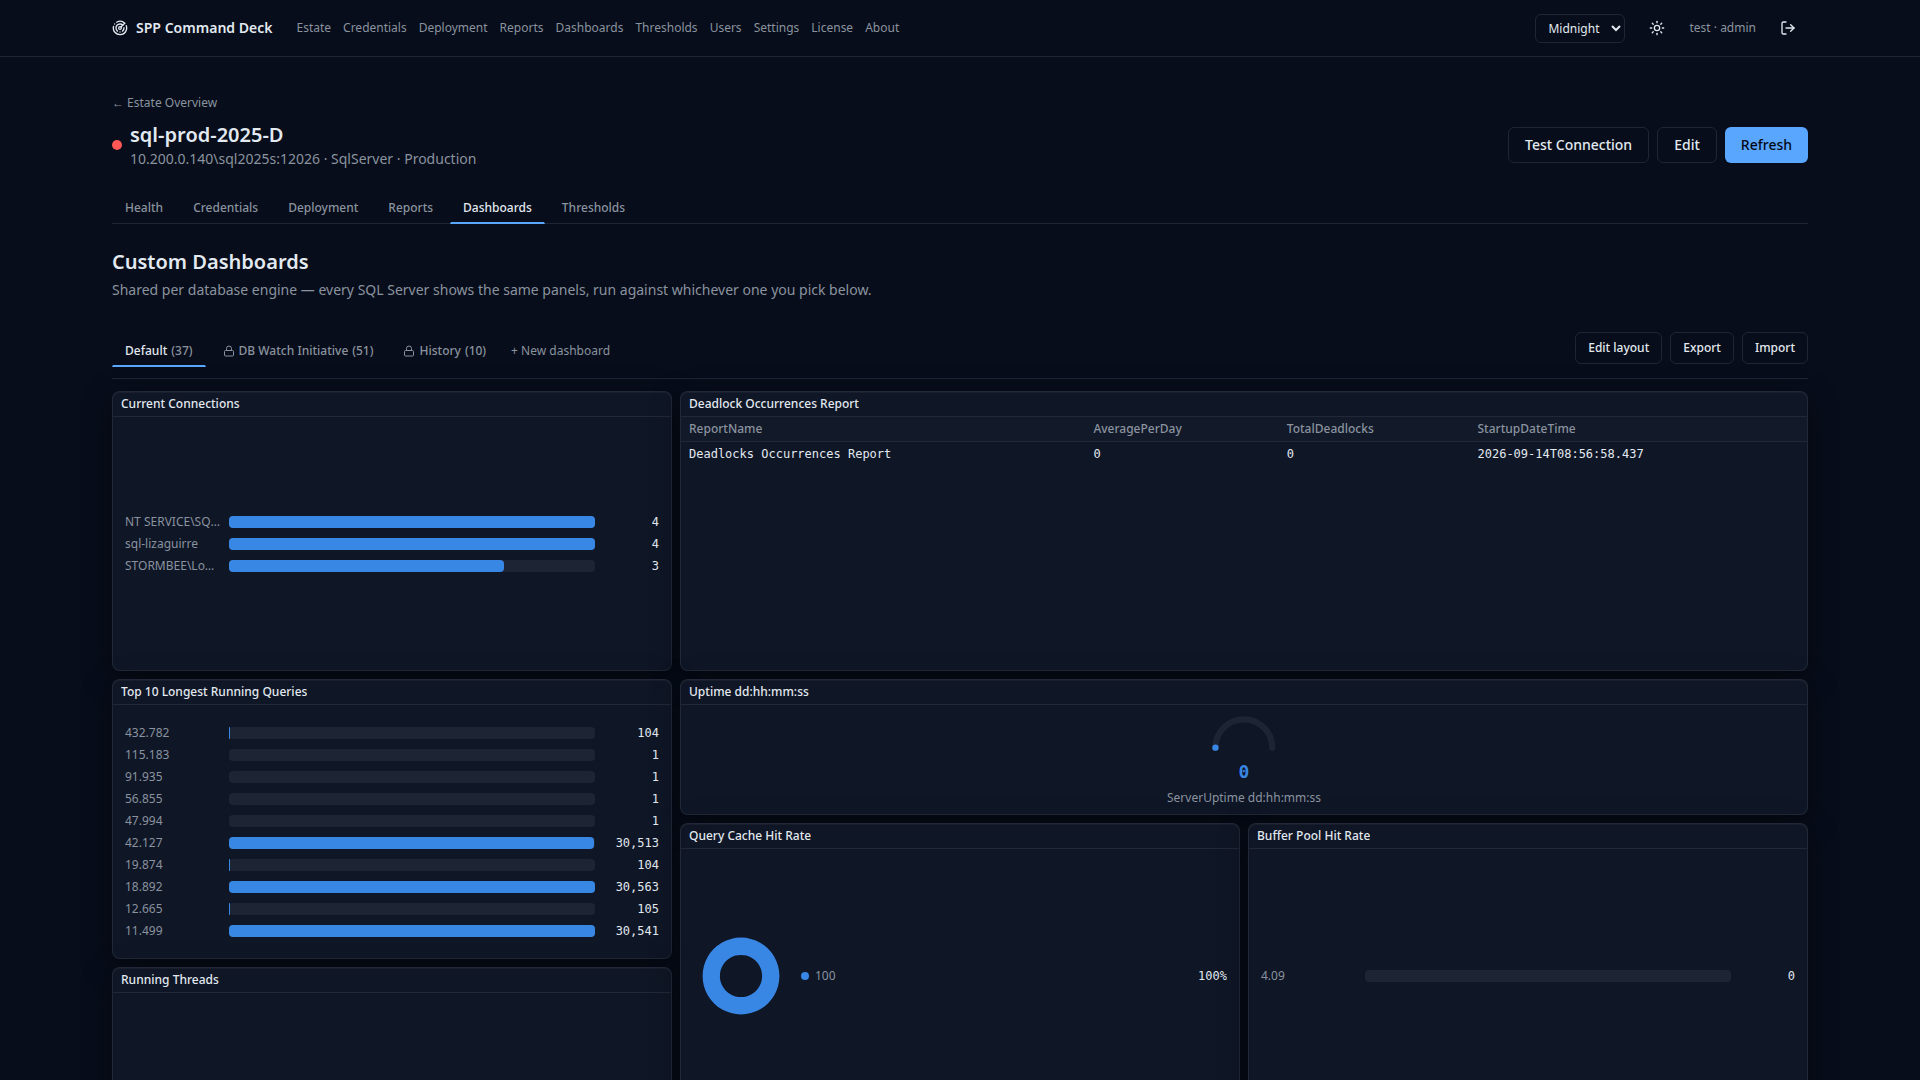
Custom dashboards
Build a dashboard against your own queries, or import one as JSON — this app’s own export format, or the reference app’s. Dashboards can be scoped to a single server or run across the estate.
- 11
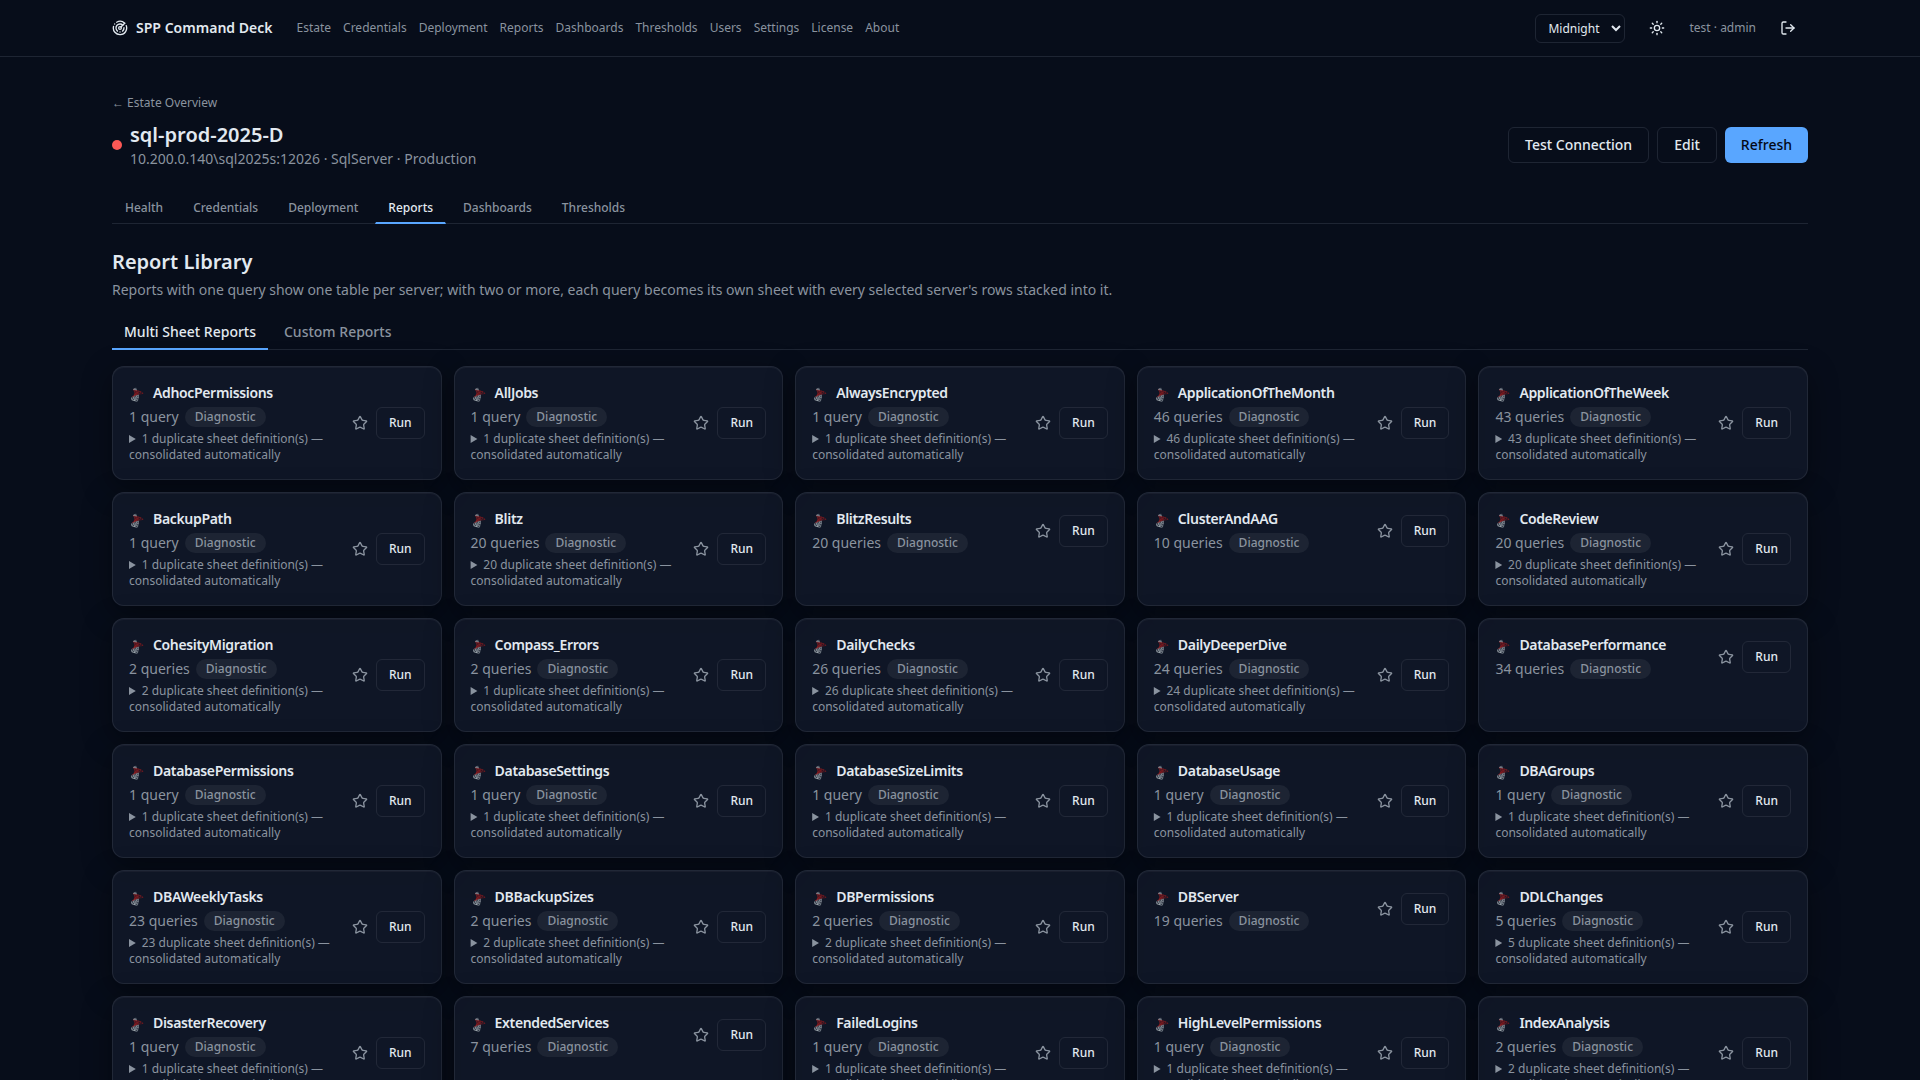
The report library
Built-in reports plus any custom report you add, including multi-sheet reports. Run one against a server and export the result rather than re-deriving the same query every quarter.
- 12
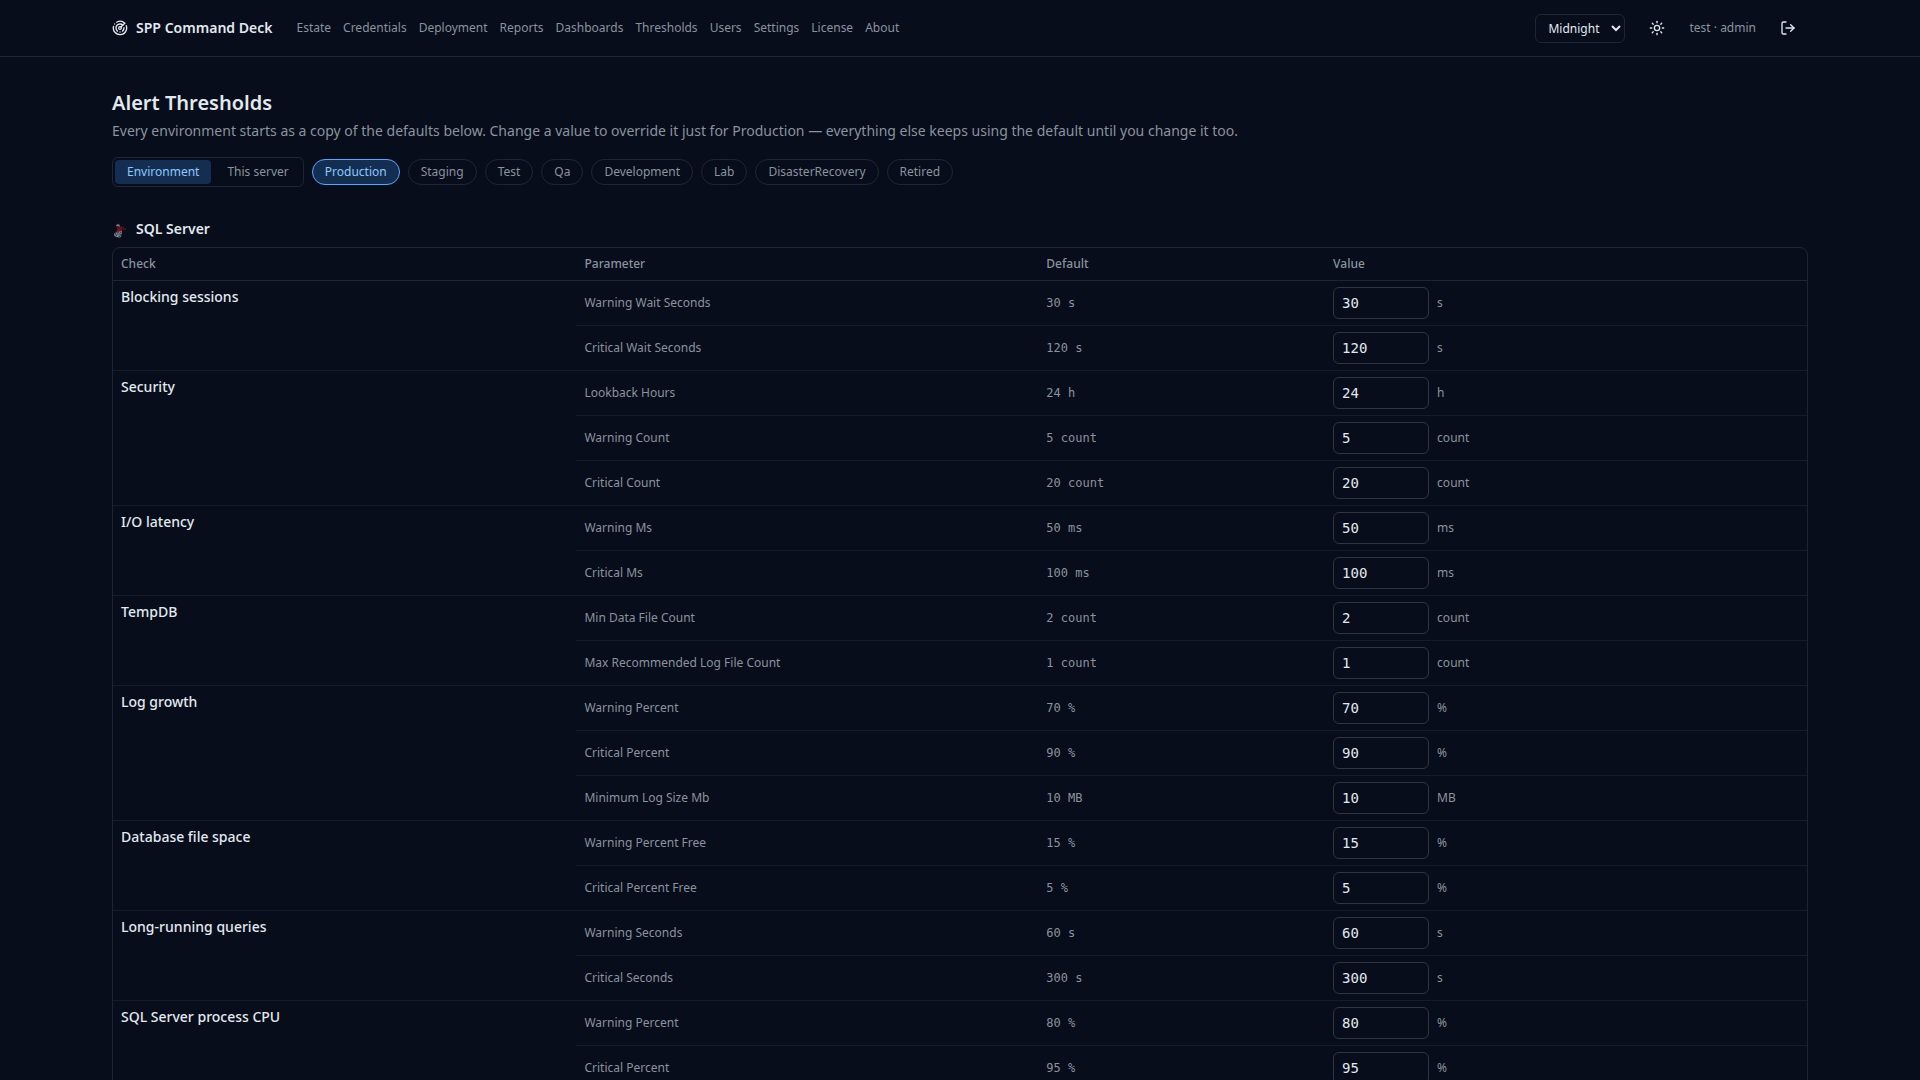
Tune the thresholds
Every check ships with a default threshold, and every default can be overridden per server — including job-name filters, so a known-noisy nightly job stops paging you without silencing the whole check.
- 13
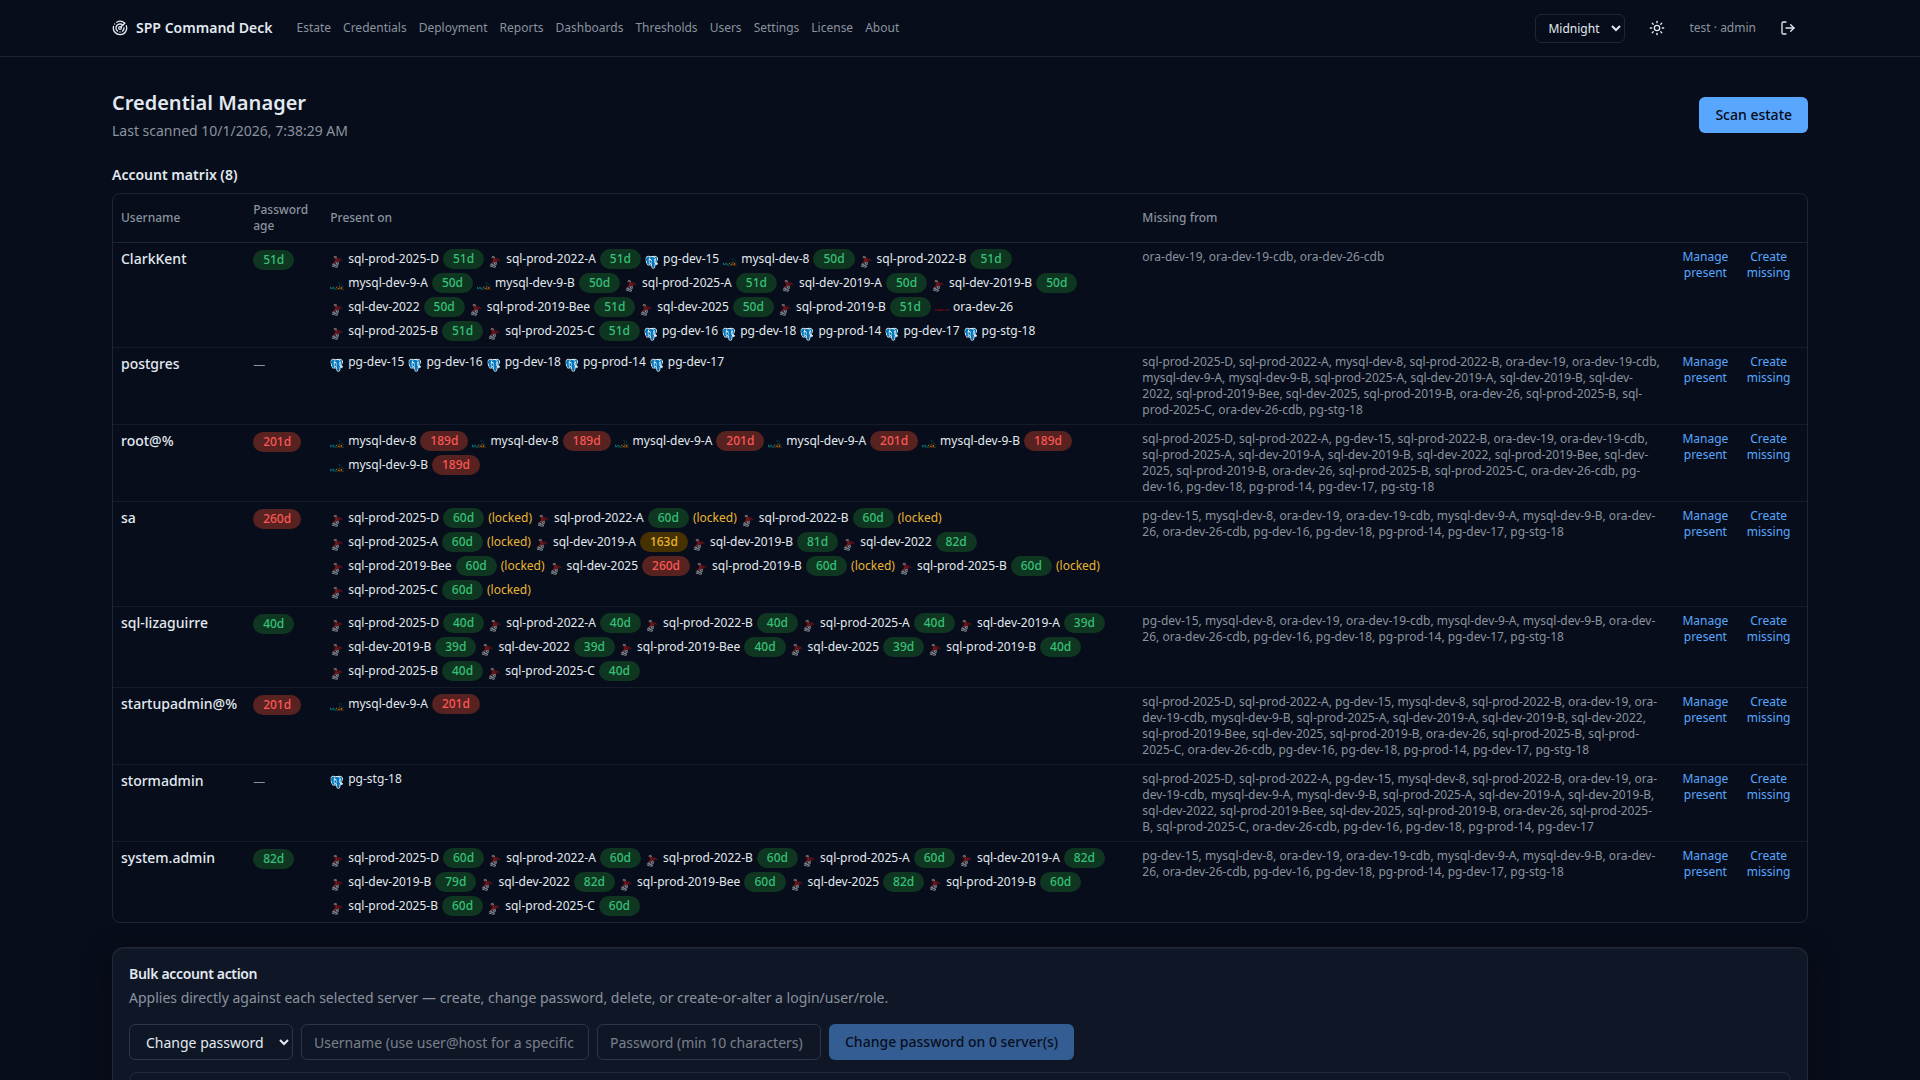
Know who has an account
Credential Manager scans each server for the accounts that exist on it, so the question "who still has access to production?" is answered from the instance itself, not from a spreadsheet someone last updated in March.
- 14
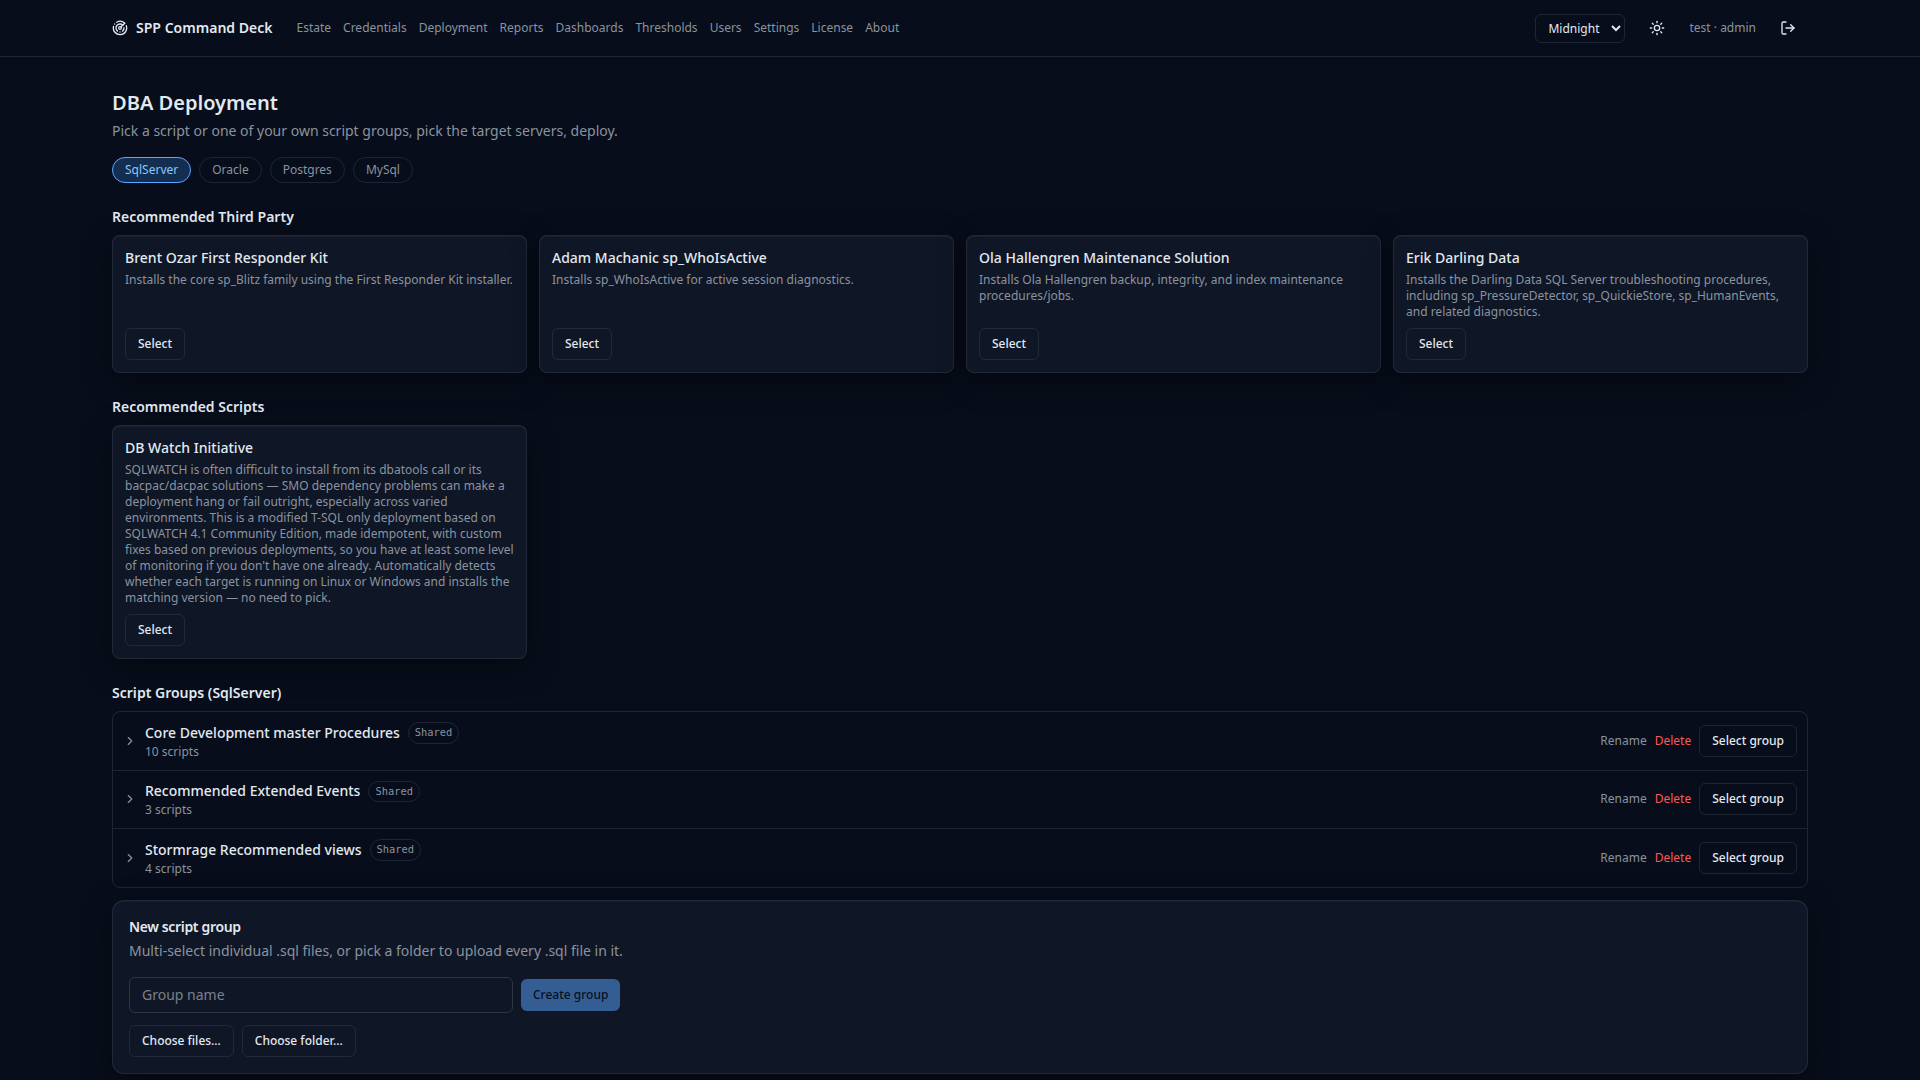
Deployment tooling
A catalog of recommended scripts and vetted third-party tooling per engine, so the useful DBA script is in the app next to the server it runs against instead of in a folder on someone’s laptop.
- 15
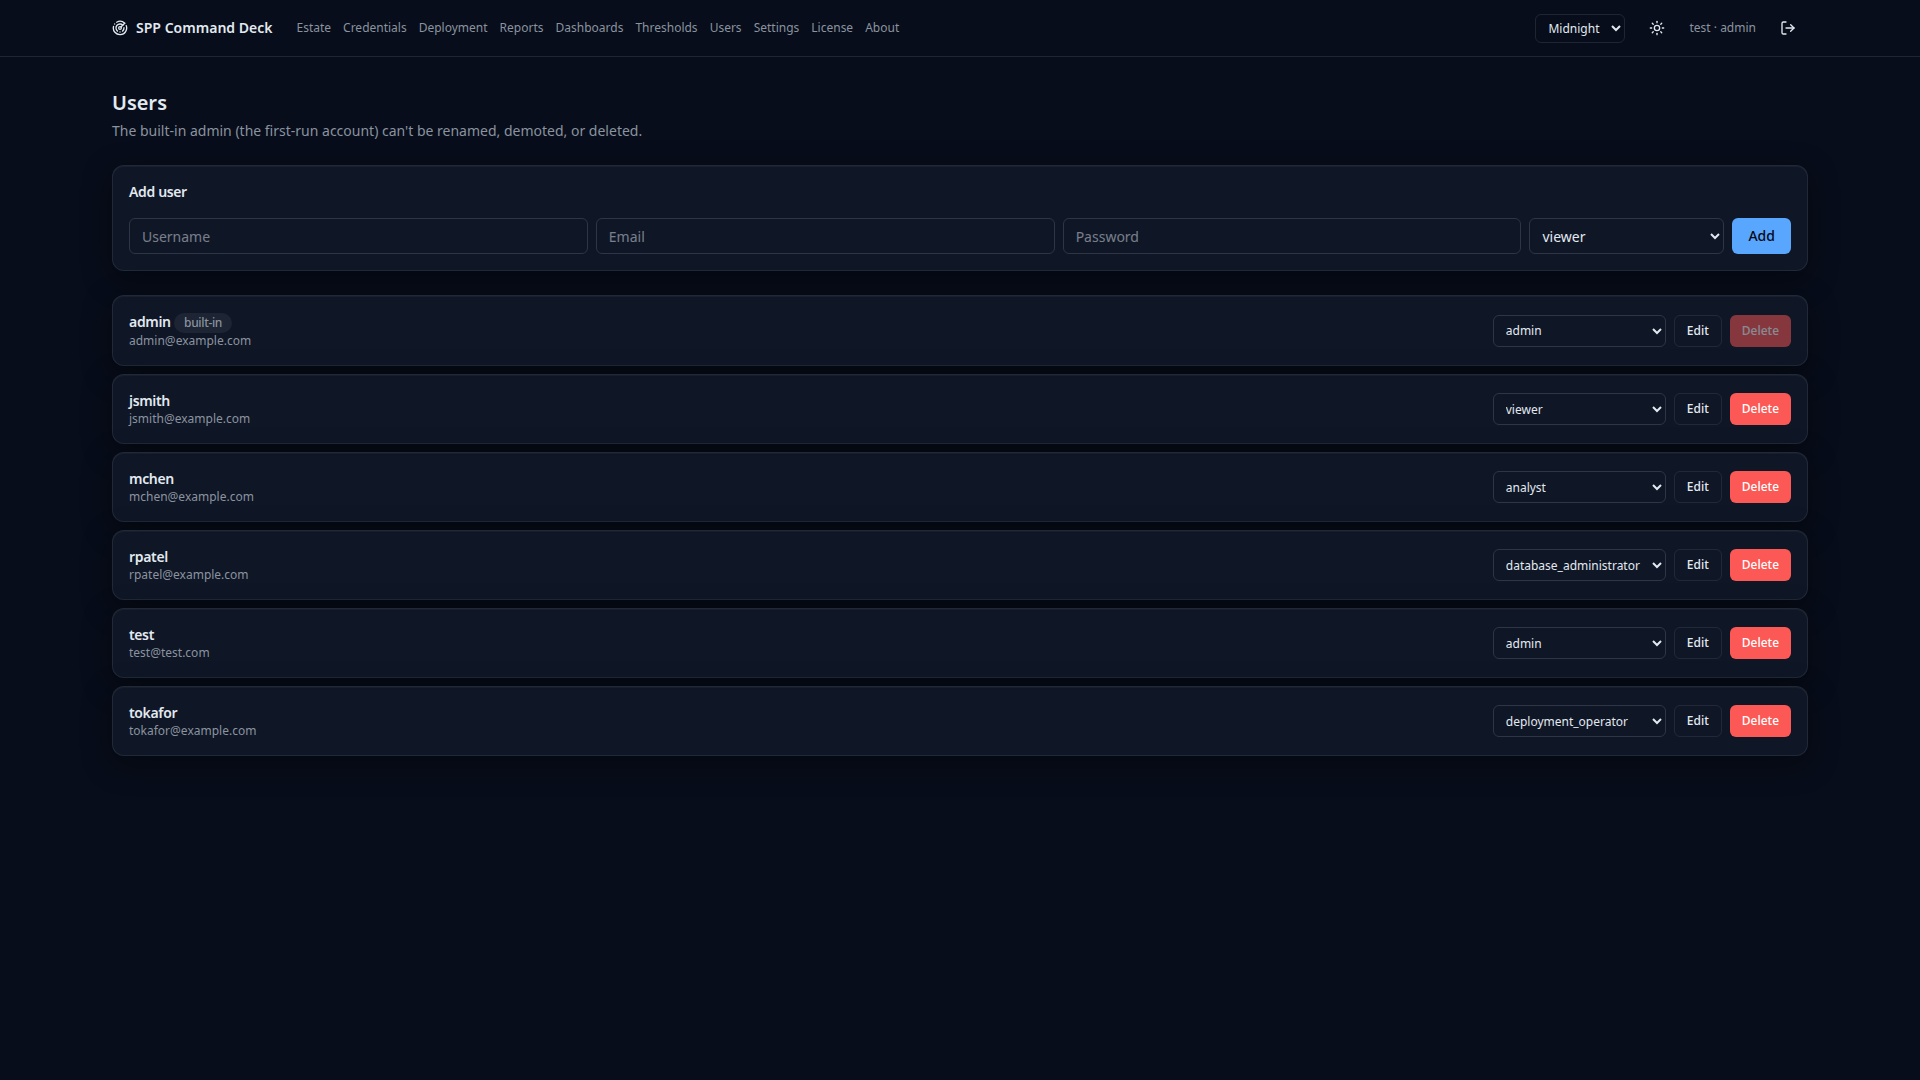
Bring your team in
Seven roles from viewer to admin — viewer, analyst, data operator, database operator, database administrator, deployment operator, admin. Give a junior DBA read-only access to production without also opening up deployment tooling or credential storage. The first-run admin is protected: it cannot be renamed, demoted or deleted.
- 16
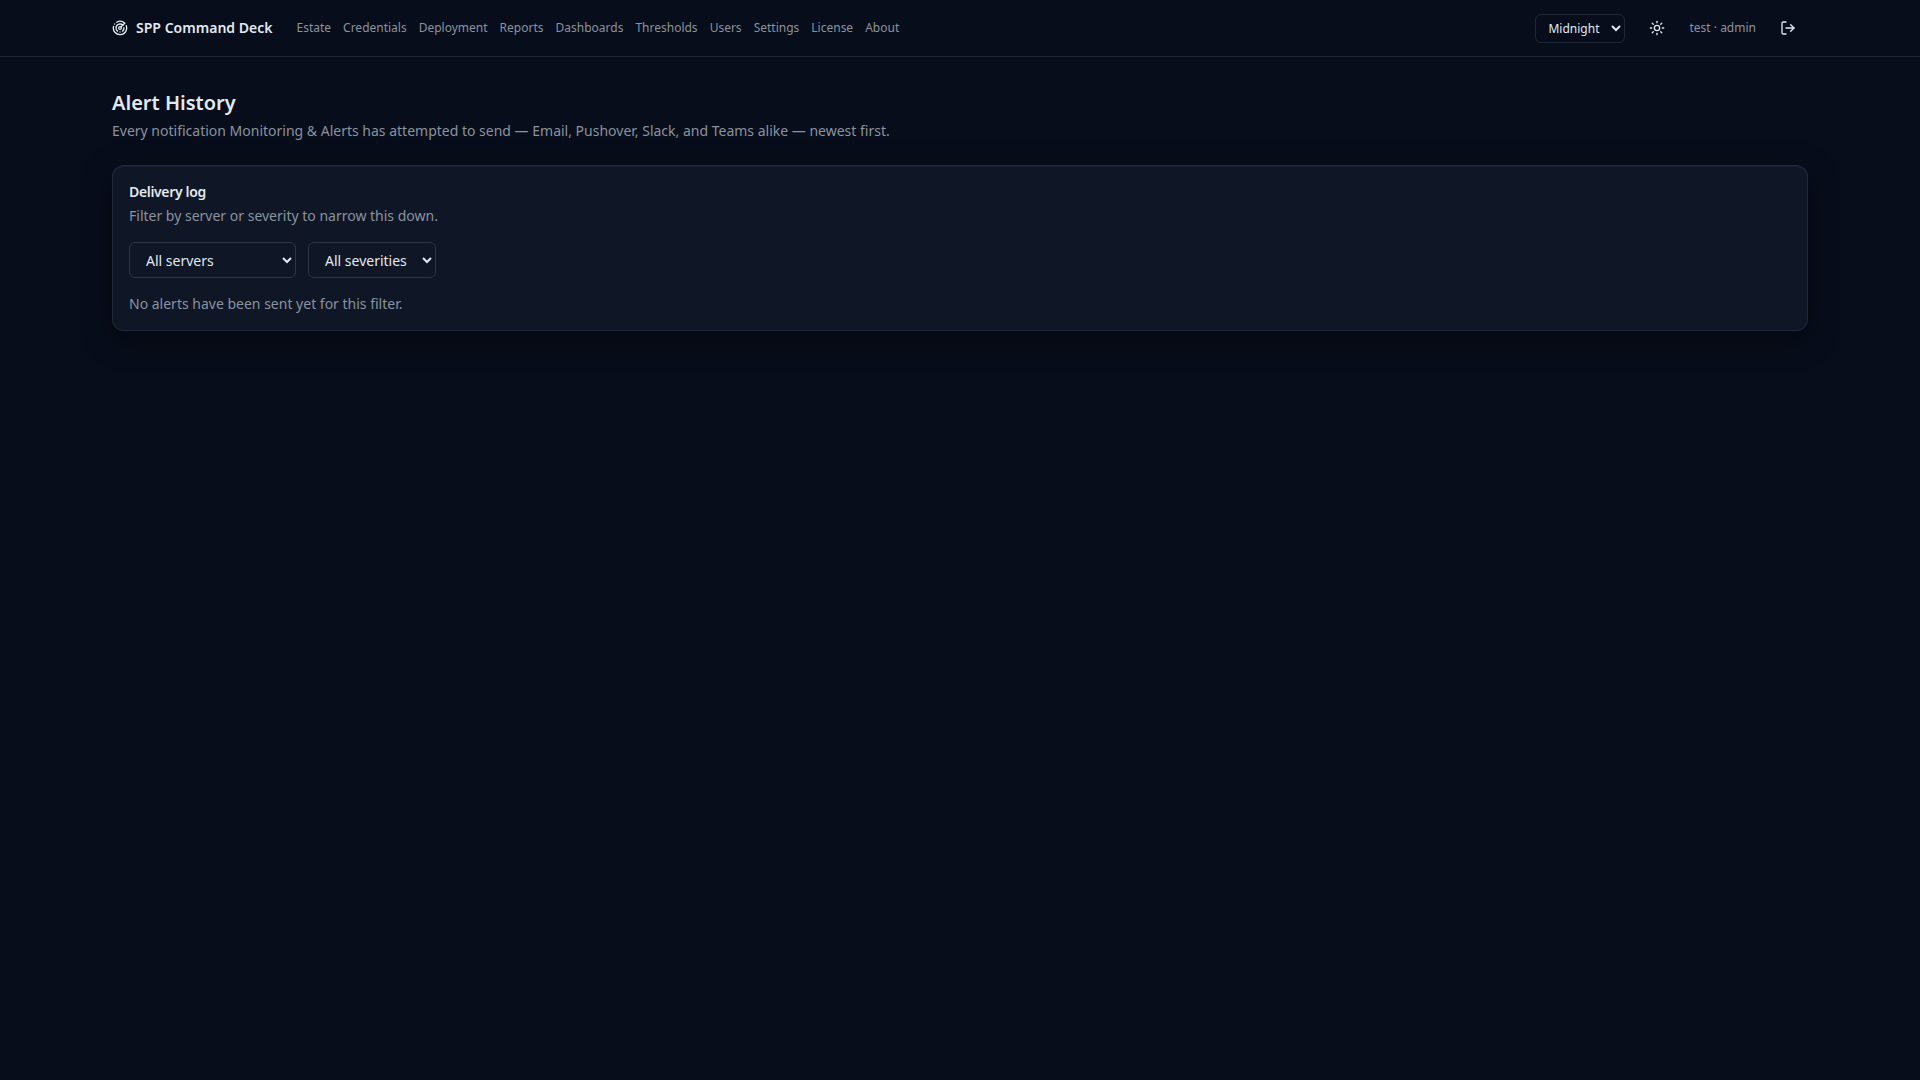
What already fired
Alert history is kept locally so you can answer "was it doing this last week?" — the question that decides whether an alert is a real regression or just Tuesday.
- 17
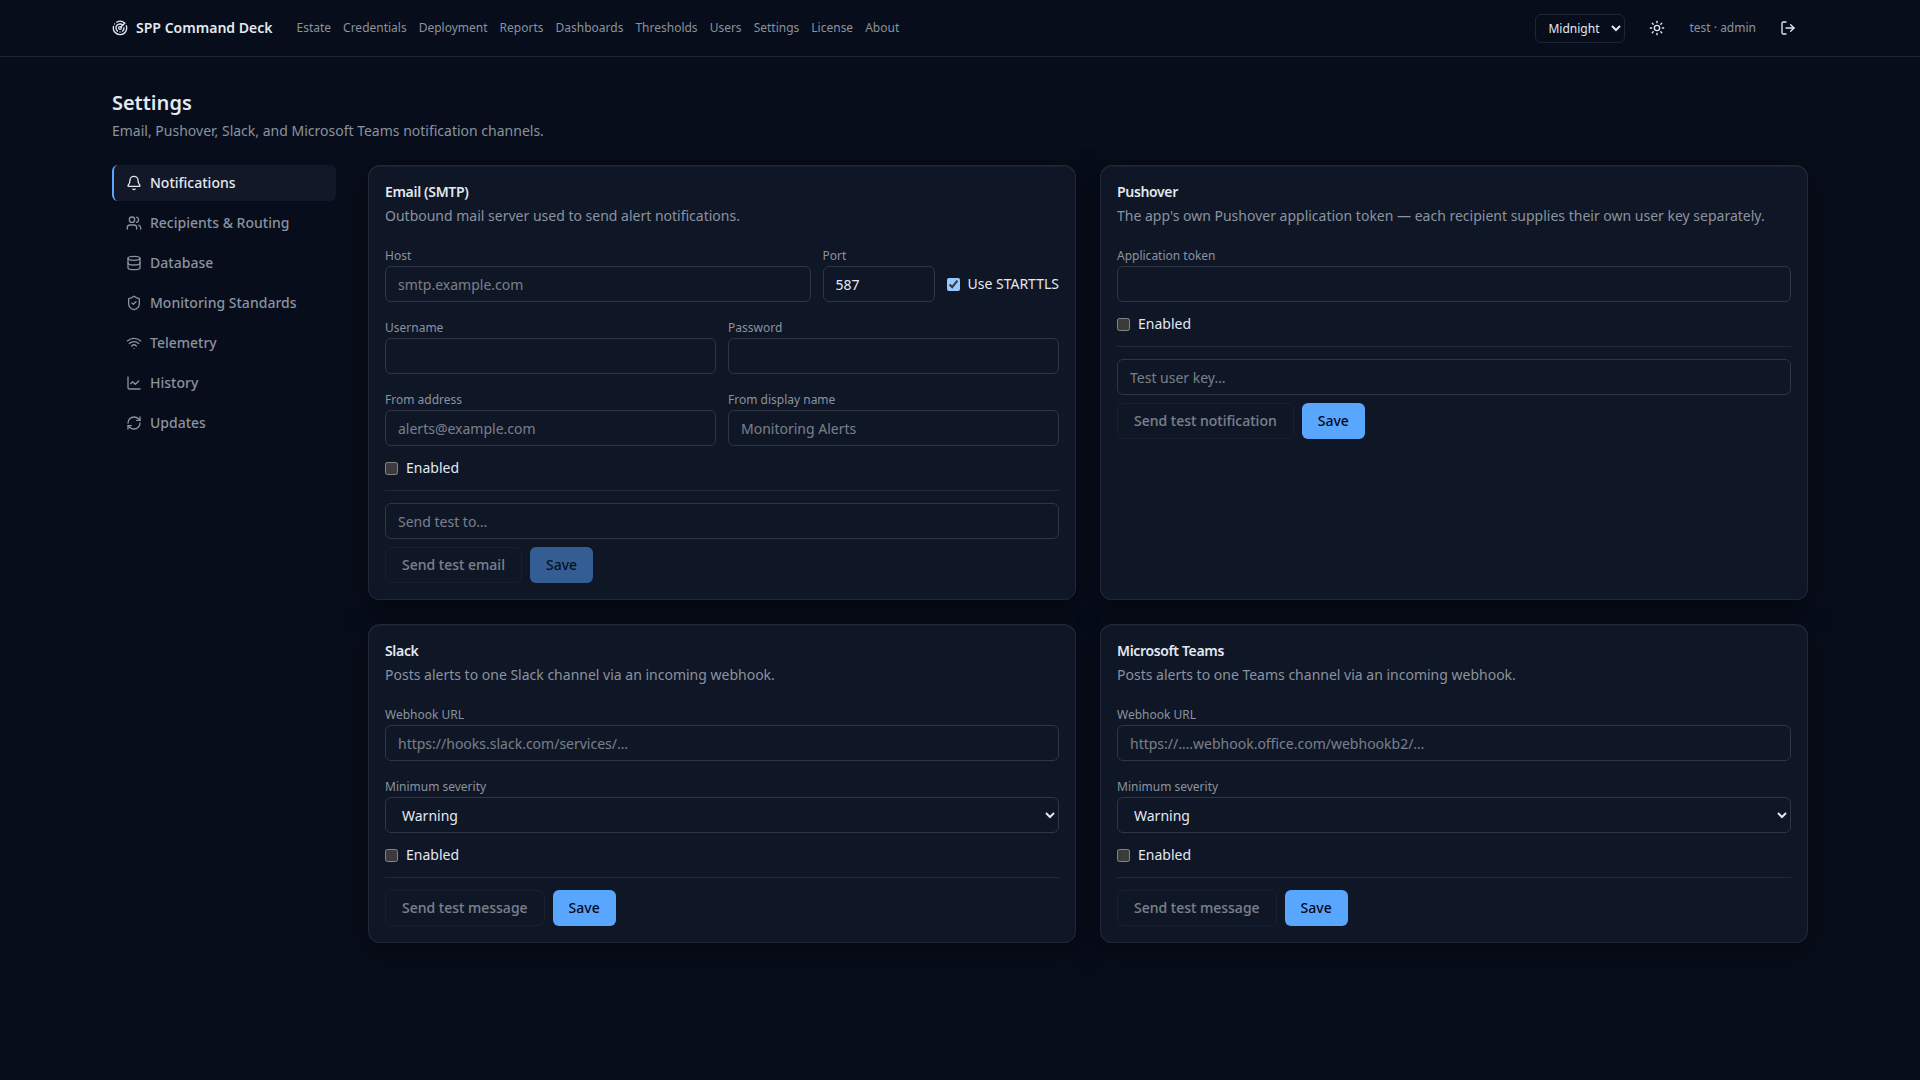
Settings, including what leaves the box
Notifications, recipients, retention and monitoring standards in one place — plus a telemetry section that exists mainly to show you it is off. Nothing about your estate leaves your network.
- 18
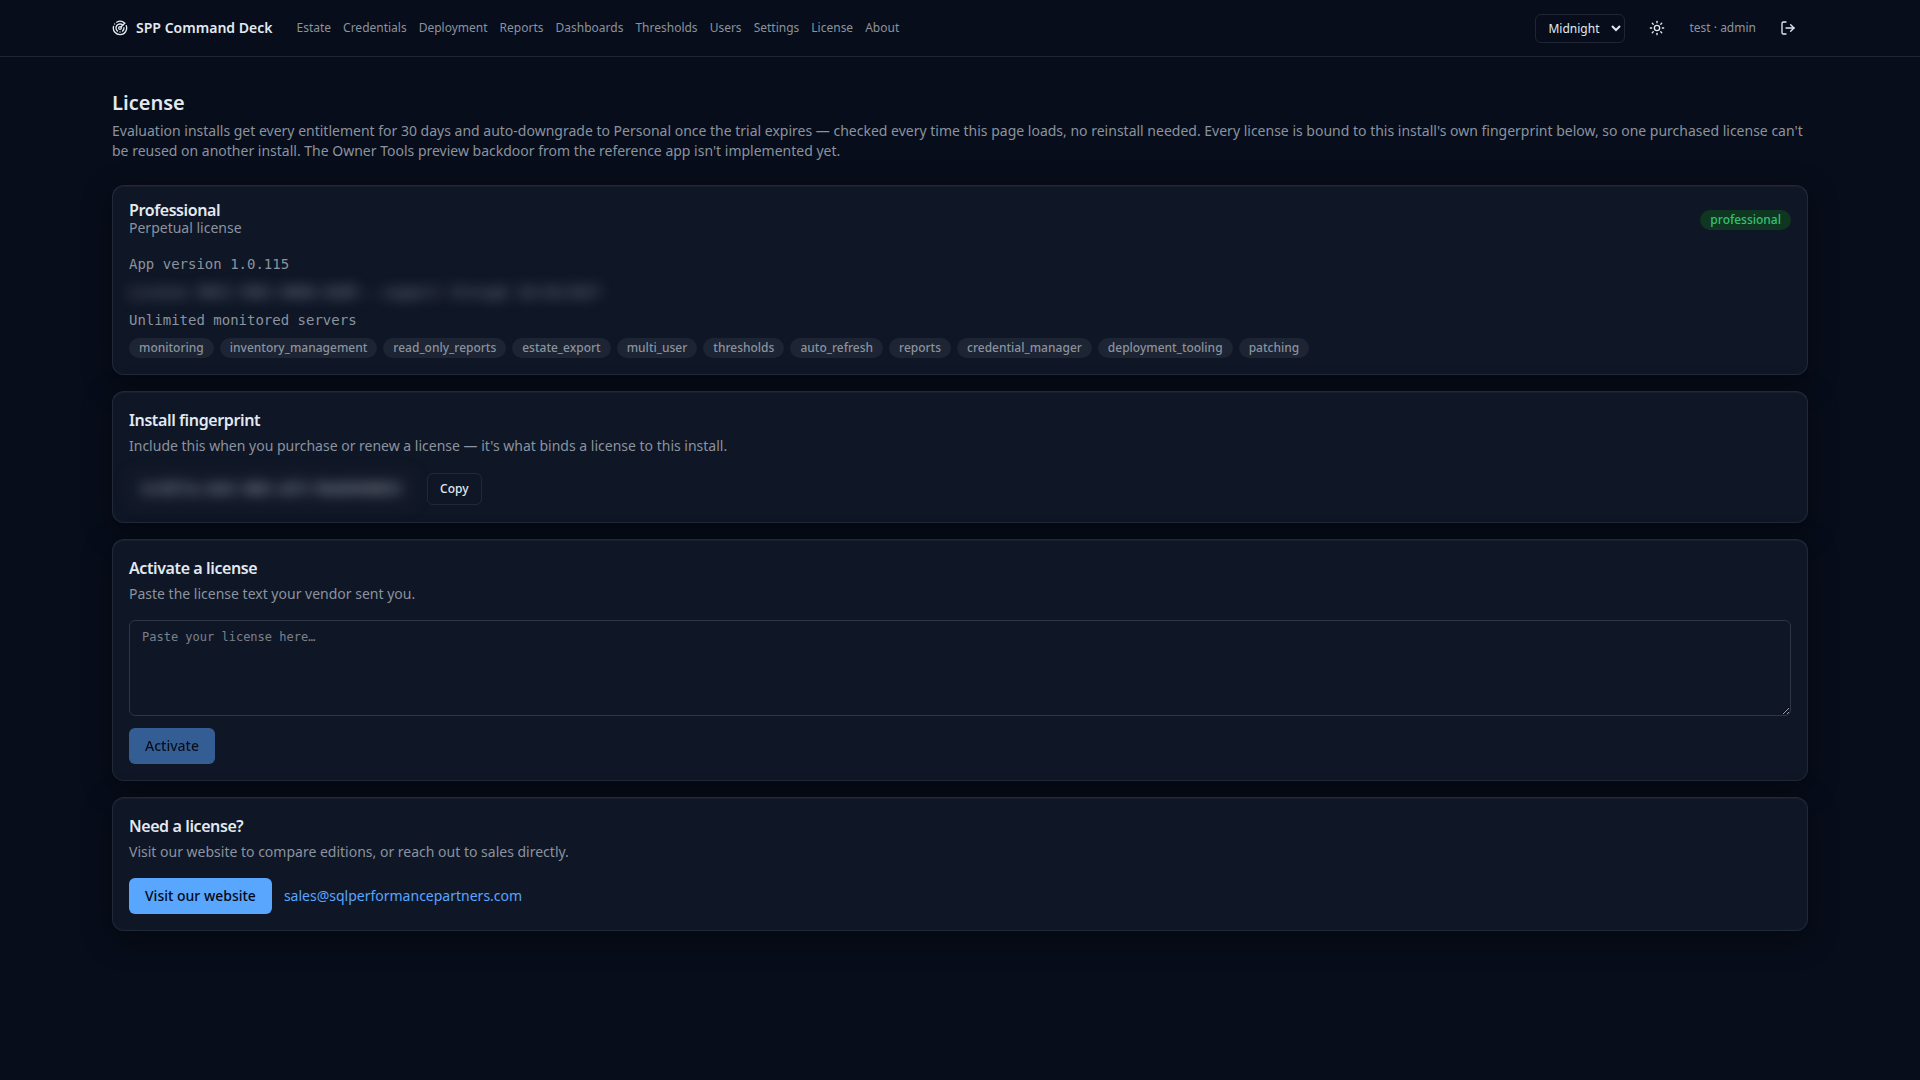
Know your license status
Current edition, entitlements and the install fingerprint that binds a license to this install — always visible, always accurate, no hidden feature flags.
- 19
Make it yours
Nine built-in themes, four light and five dark. Every screenshot above is Midnight; here is the same estate in Cloud. Pick one and it sticks per user.